by Joseph Rickert Last week, I was fortunate enough to attend the R Summit & Workshop, an invitation only event, held at the Copenhagen Business School. The abstracts for the public talks presented are online and well worth a look. Collectively they provide a snapshot of the state of development of ... [Read more...]
It seems that not a day goes by without some information security vendor releasing a report based on a survey. Thankfully, this post is not about the efficacy of survey-based reports or their findings. Today, we’re doing a makeover for Unisys, who just released their Findings from the 2015 Unisys ... [Read more...]
Visualizations made for FAO AQUASTAT: After individual Irrigated Crop Calendars for all countries were combined, it allowed for some interesting analysis of global irrigation. These included “The Big Picture” (at two levels of resolution), as well as viewing irrigation by region and by crop. All explanations and visualizations on: http://...
By Andy Nicholls, Head of Consulting Earlier this week a press release from the Linux Foundation formally unveiled The R Consortium: “a group of businesses organized under an open source governance and foundation model to provide support to the R community, … Continue reading → [Read more...]
We are happy to announce that the iptools package is now on CRAN. Formerly only available on GitHub, iptools now compiles under Debian/Ubuntu, Fedora/CentOS/RedHat and Mac OS X (we’re still working on that other operating system).
Oliver (the package co-author and on-CRAN instigator) wrote some excellent ... [Read more...]
This article is also published on RStudio’s Shiny Articles
Shiny apps often need to save data, either to load it back into a different session or to simply log some information. However, common methods of storing data from R may not work well with Shiny. Functions like write.csv() ... [Read more...]
The morning opened with someone who I was too bleary eyed to work out who it was. Possibly the dean of the University of Aalborg. Anyway, he said that this is the largest ever useR conference, and the first ever in a Nordic country. Take that, Norway! Also, considering that ... [Read more...]
Showing a third dimension on a flat computer screen is usually hard. Plotly’s interactive 3D graphing changes that. You can zoom, toggle, pan, rotate, spin, see data on the hover, and more. In this post we’ll make 3D graphs with our APIs fo... [Read more...]
After working with Tableau for the last several years, I have to admit that I’m quite impressed with the statistical capabilities of the software. It’s nowhere near the analytical powerhouse that R is, but for visualization it does a pretty good job. As good as Tableau is, much ... [Read more...]
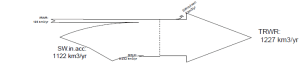
A visualization prepared for FAO AQUASTAT: In an interest to simplify the information about renewable water resources in all countries in the world, we prepared simplified visualizations of water flows through a country. Please navigate to the AQUASTAT Water Resources page and use the “Figures” dropdown to see the flow ...
by Andrie de Vries Today is the first day of UseR!2015 conference in Aalborg in Northern Denmark. But yesterday was a day packed with 16 tutorials on a range of interesting topics. I submitted a proposal many months ago to run a session on using R in Hadoop and was very ... [Read more...]
Unfortunately, you need both: R-devel (development version of R) if you want to submit your packages to CRAN, and regular R for your research (you don’t want the unstable release for that). Fortunately, installing R-devel in parallel is less trouble than one might think. Say, we want to install ... [Read more...]
A natural technique to select variables in the context of generalized linear models is to use a stepŵise procedure. It is natural, but contreversial, as discussed by Frank Harrell in a great post, clearly worth reading. Frank mentioned about 10 points against a stepwise procedure. It yields R-squared values that ... [Read more...]
These are my initial notes from useR 2015. I will/may revise when I have time. Computational Performance; Chair: Dirk Eddelbuettel Running R+Hadoop using Docker Containers (E. James Harner) Introduction Big data architectures: HDFS/Hadoop: software framework for distributed storage and distributed processing Tachyon/Spark: uses in-memory Rc2 server (R ... [Read more...]
Triangles are my favorite shape, three points where two lines meet (Tessellate, Alt-J) Inspired by recurrence plots and by the Gauss error function, I have done the following plots. The first one represents the recurrence plot of where distance between points is measured by Gauss error function: This one is ...
There has been a trend in the last few years to put interesting-looking but non-informative figures in papers; the pie chart is the worst recurrent offender. I have no idea how they keep getting included, as they’re famously misleading and awful. I want my work to look as much ... [Read more...]
These are my initial notes from useR 2015. Will revise when I have time. fbRads: Analyzing and managing Facebook ads from R (Gergely Daroczi) Modern advertising Google/Amazon/Facebook use our information Ad platforms: Google: RAdwords, facebook likes: fbRads. You can use the facebook API to get information from facebook. Get ... [Read more...]
Using R since 2002 and has been working on Rcpp, Rcpp11, Rcpp14 and dplyr internals. Worked on a number of big projects. 2005 he set up the R Graph Gallery 2009 worked on rJava 2010 Rcpp 2013 dplyr Key themes are Performance and usabililty rJava 0.7-* Creating objects was messy d [Read more...]