April 2015

Statistics journals network

April 16, 2015 | Julyan Arbel

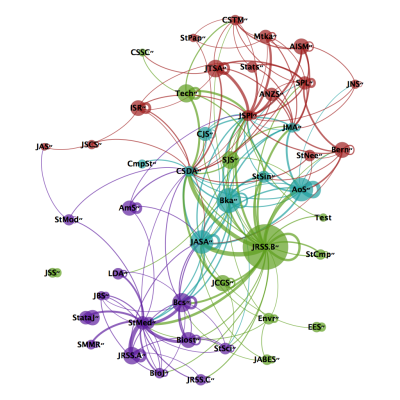
Xian blogged recently on the incoming RSS read paper: Statistical Modelling of Citation Exchange Between Statistics Journals, by Cristiano Varin, Manuela Cattelan and David Firth. Following the last JRSS B read paper by one of us! The data that are used in the paper (and can be downloaded here) are ...
[Read more...]

Knitr with Bio7

April 16, 2015 | » R

16.04.2015 In Bio7 it is possible to write a documentation in knitr. A simple visual and textual HTML editor (based on JavaFX) and an embedded Latex editor (based on TeXclipse) helps in the creation of a *.html or *.pdf documentation. For the *.pdf creation a TeX environment has to be available (... [Read more...]

Python and R: Basic Sampling Problem

April 16, 2015 | Al-Ahmadgaid Asaad

In this post, I would like to share a simple problem about sampling analysis. And I will demonstrate how to solve this using Python and R. The first two problems are originally from Sampling: Design and Analysis book by Sharon Lohr.ProblemsLet $N=6$ and $n=3$. For purposes of studying sampling ... [Read more...]

R e SPOTIFY

April 15, 2015 | Tiago Dantas

R+API+SPOTIFYHoje resolvi acessar a API do serviço de streaming de música Spotify, na minha opinião o melhor da categoria e um dos apps que mais utilizo. Só pra constar, odeio todo o conceito do potencial concorrente, Tidal.Mais uma vez, tudo foi feito utilizando o ... [Read more...]

Scraping Web Pages With R

April 15, 2015 | Tony Hirst

One of the things I tend to avoid doing in R, partly because there are better tools elsewhere, is screenscraping. With the release of the new rvest package, I thought I’d have a go at what amounts to one of the simplest webscraping activites – grabbing HTML tables out of ...
[Read more...]

New Packages for Reading Data into R

April 15, 2015 | dogle

Hadley Wicham has announced two new package for reading external data into R that will likely be of great interest to fisheries scientists. readr — Several new functions that replace the traditional read.csv() and read.table() (among others).  Hadley’s announcement is here, … Continue reading → [Read more...]

Using R in Myanmar (and other low-bandwidth environments)

April 15, 2015 | David Smith

R is already in use in well over 100 cities around the world, and now we can add another to the list: Yangon, Myanmar. Ben Marwick is a trainer with Software Carpentry (a non-profit organization devoted to improving basic computing skills among researchers in science, engineering, medicine, and other disciplines), and ... [Read more...]

The Problem with Propensity Scores

April 14, 2015 | Jacob Simmering

Are Propensity Scores Useful? Effect estimation for treatments using observation data isn't always straight forward. For example, it is very common that patients who are treated with a certain medication or procedure are healthier than those who are not treated. Those who aren't treated may not be treated due to ... [Read more...]

Bernouilli, Montmort and Waldegrave

April 14, 2015 | xi'an

In the last issue of Statistical Science, David Belhouse [author of De Moivre’s biography]  and Nicolas Fillion published an accounting of a discussion between Pierre Rémond de Montmort, Nicolaus Bernoulli—”the” Bernoulli associated with the St. Petersburg paradox—, and Francis Waldegrave, about the card game of Le Her (... [Read more...]

Create Colorful Graphs in R with RColorBrewer and Plotly

April 14, 2015 | chelsea

RColorBrewer is an R package that allows users to create colourful graphs with pre-made color palettes that visualize data in a clear and distinguishable manner. There are 3 categories of palettes: qualitative, diverging, and sequential. Qualitative palettes employ different hues to create visual differences between classes. These palettes are suggested for ... [Read more...]

ModSpace as a SAS DD Replacement

April 14, 2015 | Mango Solutions

ModSpace is our web-based collaborative platform used by groups of analysts to store, share and discover models, data and scripts in a version controlled environment. We were approached by a customer looking to replace SAS DD, to explore the possibility … Continue reading → [Read more...]

Animated paths in R: toy example

April 14, 2015 | Matt Leonawicz

Recently I have shared examples of animations made using R which feature traversal of pathways, specifically grid cell borders and great circle arcs. Here I provide the basic code required to generate a path sequence from a path. The fundamental ideas are as follows: Pathways are represented by lines. Lines ...
[Read more...]

Project Tycho, ggplot2 and the shameless stealing of blog ideas

April 14, 2015 | nsaunders

Last week, Mick Watson posted a terrific article on using R to recreate the visualizations in this WSJ article on the impact of vaccination. Someone beat me to the obvious joke. @BioMickWatson @pathogenomenick Nice quilt plot. — Ed Yong (@edyong209) April 9, 2015 Someone also beat me to the standard response whenever base ...
[Read more...]

All Aboard! The R Service Bus 6.2

April 14, 2015 | tobias

Tuesday 14 April 2015 - 14:35 As R has continued its growth in populary, it's made some exotic friends. Friends who speak other (programming) languages. Friends who live on servers and virtual machines. Friends who sometimes need to set aside t... [Read more...]

Wrangling Complex Spreadsheet Column Headers

April 14, 2015 | Tony Hirst

[This isn’t an R post, per se, but I’m syndicating it via RBloggers because I’m interested – how do you work with hierarchical column indices in R? Do you try to reshape the data to something tidier on the way in? Can you autodetect elements to help with ...
[Read more...]
1 4 5 6 7 8 11

Never miss an update!
Subscribe to R-bloggers to receive
e-mails with the latest R posts.
(You will not see this message again.)

Click here to close (This popup will not appear again)