
24 Days of R: Day 23
[This article was first published on PirateGrunt » R, and kindly contributed to R-bloggers]. (You can report issue about the content on this page here)
Want to share your content on R-bloggers? click here if you have a blog, or here if you don't.
Want to share your content on R-bloggers? click here if you have a blog, or here if you don't.
Penultimate post, I'm going to take a quick look at the Gini indicator for wealth inequality. Data comes from the World Bank.
I've downloaded the zipped file, decompressed it and given it a different name. I'm going to
dfGini = read.csv("./Data/Gini.csv", stringsAsFactors = FALSE, skip = 2)
colnames(dfGini) = gsub("X", "", colnames(dfGini))
library(reshape2)
mdf = melt(dfGini, id.vars = colnames(dfGini)[1:4])
mdf = mdf[!is.na(mdf$value), ]
colnames(mdf)[1:2] = c("Name", "Code")
library(plyr)
dfCount = ddply(mdf, "Code", .fun = nrow)
atLeast5 = dfCount$Code[dfCount$V1 >= 5]
mdf = mdf[mdf$Code %in% atLeast5, ]
This will give us a decent set of data. How does this look when we plot it?
library(ggplot2)
ggplot(mdf, aes(x = variable, y = value, group = Code)) + geom_line()
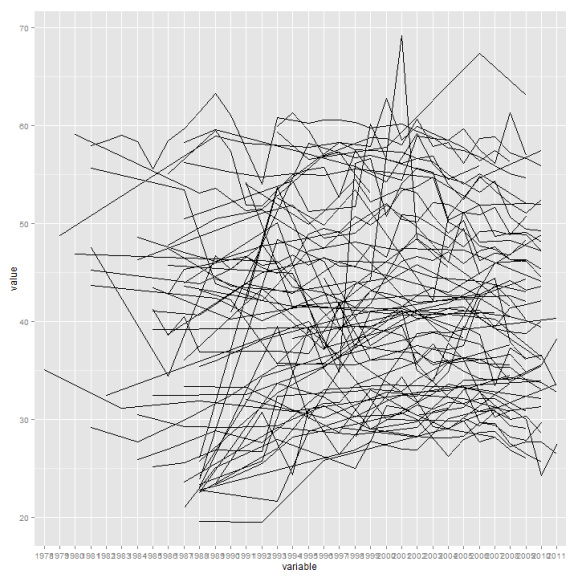
Ugh. That looks like nothing. It's a bit late and I'm not all that keen for insight. What countries have had the biggest reduction in income inequality?
dfMove = ddply(mdf, "Code", summarize, Diff = max(value) - min(value))
dfMove = dfMove[order(dfMove$Diff, decreasing = TRUE), ]
bigMoves = dfMove$Code[1:5]

ggplot(mdf[mdf$Code %in% bigMoves, ], aes(x = variable, y = value, group = Code)) +
    geom_line()
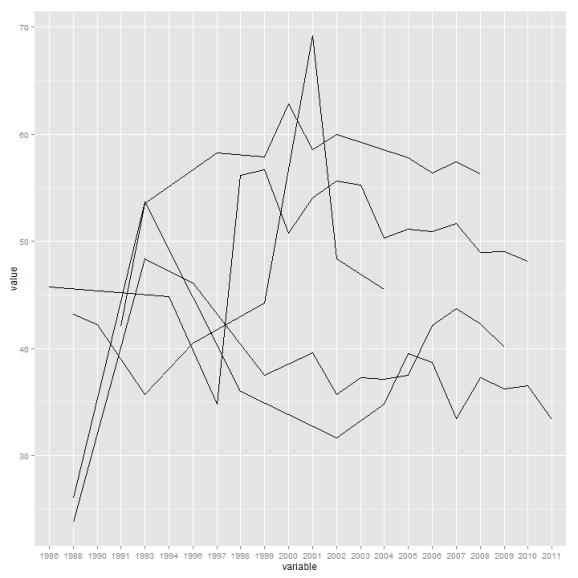
That's better, but still not very informative. I'm sleepy and going to bed.
sessionInfo

## function (package = NULL)
## {
##     z <- list()
##     z$R.version <- R.Version()
##     z$platform <- z$R.version$platform
##     if (nzchar(.Platform$r_arch))
##         z$platform <- paste(z$platform, .Platform$r_arch, sep = "/")
##     z$platform <- paste0(z$platform, " (", 8 * .Machine$sizeof.pointer,
##         "-bit)")
##     z$locale <- Sys.getlocale()
##     if (is.null(package)) {
##         package <- grep("^package:", search(), value = TRUE)
##         keep <- sapply(package, function(x) x == "package:base" ||
##             !is.null(attr(as.environment(x), "path")))
##         package <- sub("^package:", "", package[keep])
##     }
##     pkgDesc <- lapply(package, packageDescription, encoding = NA)
##     if (length(package) == 0)
##         stop("no valid packages were specified")
##     basePkgs <- sapply(pkgDesc, function(x) !is.null(x$Priority) &&
##         x$Priority == "base")
##     z$basePkgs <- package[basePkgs]
##     if (any(!basePkgs)) {
##         z$otherPkgs <- pkgDesc[!basePkgs]
##         names(z$otherPkgs) <- package[!basePkgs]
##     }
##     loadedOnly <- loadedNamespaces()
##     loadedOnly <- loadedOnly[!(loadedOnly %in% package)]
##     if (length(loadedOnly)) {
##         names(loadedOnly) <- loadedOnly
##         pkgDesc <- c(pkgDesc, lapply(loadedOnly, packageDescription))
##         z$loadedOnly <- pkgDesc[loadedOnly]
##     }
##     class(z) <- "sessionInfo"
##     z
## }
## <bytecode: 0x0000000012974858>
## <environment: namespace:utils>

To leave a comment for the author, please follow the link and comment on their blog: PirateGrunt » R.
R-bloggers.com offers daily e-mail updates about R news and tutorials about learning R and many other topics. Click here if you're looking to post or find an R/data-science job.
Want to share your content on R-bloggers? click here if you have a blog, or here if you don't.