R-ratio vs mean-variance optimization
Want to share your content on R-bloggers? click here if you have a blog, or here if you don't.
I am looking at the following tickers from 2005-01-01 to 2008-01-01. The tickers are GE, F, MSFT, DELL, INTC. I will find the mean-variance weights and the R-ratio weights and then test portfolio performance from 2008-01-01 to 2010-01-01. This is a pretty limited test as the portfolio weights will be static over the test period, which is very unrealistic. But it still will give us a general idea of the relative performance of each optimization technique in case of extreme events (2008 crisis in this case).
Using the procedures I went over in my previous posts I obtained the following weights for each technique:
Mean-Variance: GE-19.8% F-0% MSFT-70.4% DELL-0% INTC-9.8%
R-ratio: GE-80.3% F-0.7% MSFT-14% DELL-0% INTC-5%
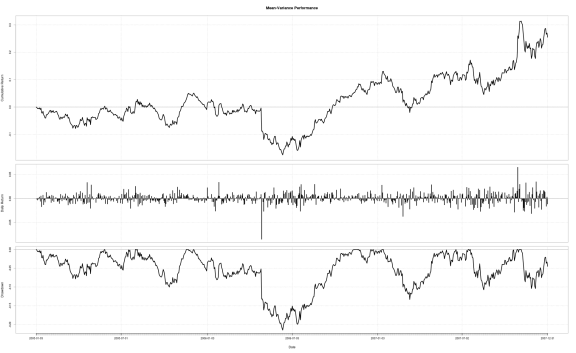
These are the results for the mean-variance portfolio from 2005-01-01 to 2008-01-01
Cumulative Return: 0.25507335 Annual Return: 0.07888944
Annualized Sharpe Ratio: 0.47503374 Win %: 0.51128818
Annualized Volatility: 0.16607124 Maximum Drawdown: -0.21479303
Max Length Drawdown: 236.00000000
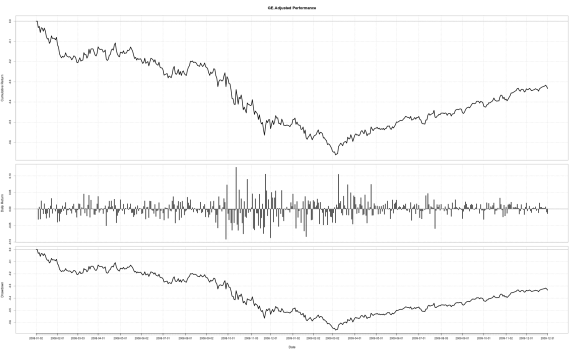
 And this is how the mean-variance portfolio did from 2008-01-01 to 2010-01-01:
Cumulative Return: -0.3332456 Annual Return: -0.1831219
Annualized Sharpe Ratio: -0.4551308 Win %: 0.5039683
Annualized Volatility: 0.4023501 Maximum Drawdown: -0.6618125
Max Length Drawdown: 504.0000000
Now, moving on to returns from the r-ratio portfolio from 2005-01-01 to 2008-01-01:
Cumulative Return: 0.10471265 Annual Return: 0.03384322
Annualized Sharpe Ratio: 0.23811103 Win %: 0.50464807
Annualized Volatility: 0.14213208 Maximum Drawdown: -0.13000366
Max Length Drawdown: 345.00000000
And from 2008-01-01 to 2010-01-01
Cumulative Return: -0.5929209 Annual Return: -0.3614045
Annualized Sharpe Ratio: -0.7272896 Win %: 0.4920635
Annualized Volatility: 0.4969197 Maximum Drawdown: -0.8058170
Max Length Drawdown: 444.0000000
Very interesting results. The R-ratio portfolio performed substantially worse than the minimum-variance portfolio, contrary to my original hypothesis. This may well be due to the very small size of the portfolio we were testing, leaving it vulnerable to idiosyncratic risk. For more robust results, I will need to run these tests on portfolios of much greater size to wash out idiosyncratic risk. I will need to conduct this test on various portfolios of a fixed size (number of securities and market cap) to get a broader understanding of the variation in performance between the two optimization techniques.
It could also be that the distribution of the securities changed, rendering the CVaR values used to calculate the R-ratio wrong. In fact, we would expect the distributions to change, given the magnitude of the events which occurred in 2008 (and how far out in the tails they were considered to be).
R-bloggers.com offers daily e-mail updates about R news and tutorials about learning R and many other topics. Click here if you're looking to post or find an R/data-science job.
Want to share your content on R-bloggers? click here if you have a blog, or here if you don't.


