Creating a BI Dashboard: Part 1
Want to share your content on R-bloggers? click here if you have a blog, or here if you don't.
Introduction
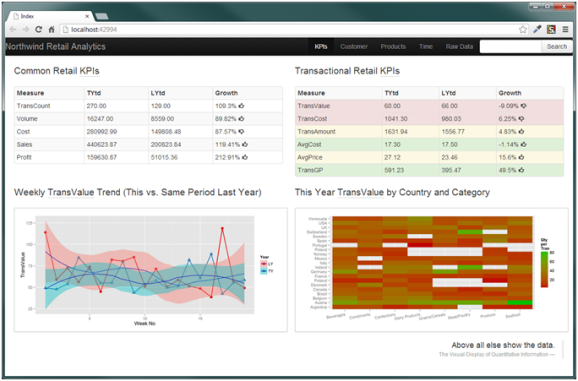
A few first posts of this blog will demonstrate how to build each report hosted by the business intelligence (BI) application dashboard shown below (see Fig. 1). This application uses the following tools and technologies
- R – a free software environment for statistical computing and graphics,
- ASP.NET MVC4 – a free framework for building web applications,
- Twitter Bootstrap – a free collection of CSS-based design templates for interface components, as well as JavaScript extensions,
- a well-known Northwind database as source of the data,
- Microsoft® SQL Server 2012 Express – a free database server, and
- Visual Studio Express 2012 for Web – a free widely used Integrated Development Environment.
Please use the web links provided above to download the listed software components if you like to follow along. Although it might sound obvious, the sequence of the installation is important, so install ASP.NET MVC after VS Express and install Northwind database after MS SQL 2012 Express. How to: Install Sample Databases page provides an instruction how to make the Northwind database compatible with MS SQL Server 2012.
Some KPIs calculated by the application require a product cost that does not exist in the original Northwind database. Click on this link to download an SQL script that recreate and populate the Product table, including the UnitCost field and updates the UnitCost field in the Order Details table as well. Make sure that you deleted the original Products table and added the UnitCost field to the Order Details table before the execution of the downloaded script from MS Server Management Studio.
You also need to download and install next R packages: RODBC, R2HTML, and GGPLOT2. The following command install.packages(c (“RODBC”,”R2HTML”)) executed from the command prompt in the R console does the trick.

Figure 1. BI Dashboard built with R, ASP.NET MVC and Bootstrap
A goal of a BI application is to “transform the data to most effectively support decision making“. These days the most effective support means not just reporting and online analytical processing functions, but includes data and text mining, predictive analytics and even more. This explains the selection of R that contains well over a thousand (and this number is growing) of statistical, data mining, and visualisation packages.
On the other hand, the Internet is an effective way to deliver and maintain at least some software applications and BI applications fall into this category although the ASP.NET is not the only option, which enables such a delivery of course. Another choice, for example, could be the Shiny server. It is a promising technology although at the moment it is very limited for developing web applications UI.
Data Extraction and Transformation
The Figure 2 below illustrates the application architecture and the data flow.

Figure 2. The application architecture and data flow.
The main component of the application is the R engine (a collection of R routines). The engine extracts the data required for each report from the Northwind database, performs necessary analytic calculations and data transformations and passes the results to the Web server that brings it to the end-users.
Let us begin with the Common Retail KPIs report that is located in the top left corner of the above dashboard page. The Listing 1 shows the code of the routine that does the “R bit” of the Common Retail KPIs report.
library(RODBC)
library(R2HTML)
cn<-odbcConnect('NW',uid='******',pwd='******')
coreKPI<-sqlFetch(cn,'Ch1_Core_KPIs_vw')
odbcClose(cn)
tmp tmp tmp coreKPI$Growth colnames(coreKPI)<-c('Measure','TYtd','LYtd','Growth')
wd htmldir setwd(htmldir)
filename <- 'coreKPI.html'
if(file.exists(filename)) file.remove(filename)
HTML(coreKPI, file = filename,nsmall=2,decimal.mark='.',row.names=FALSE,Border='0')
setwd(wd)
Listing 1. CommonKPI.r R procedure
The above routine
- opens the Northwind ODBC connection (it is named as NW in the code),
- runs the Ch1_Core_KPIs_vw view (see Listing 2) that returns the data set shown in the Table 1 and saves it in the coreKPI data frame variable than
- adds a new calculated vector tmp and applies rounding and formatting to its values,
- appends the last column of the coreKPI data frame that holds the HTML code for the Bootstrap icons, and finally
- saves the updated version of the coreKPI data frame as an HTML snippet (see Listing 4).
I assume that the reader has some experience with R language, but if you forgot some R functions, type help(FunctionName) at the R command prompt to see the help.
SELECT TOP (100) PERCENT Measure, TYtd, LYtd, Growth
FROM
(
    SELECT '1' AS SO, Measure, TYtd, LYtd,
            CASE WHEN [TYtd] < [LYtd] THEN '<i class="icon-thumbs-down"></i>' ELSE '<i class="icon-thumbs-up"></i>' END AS Growth
    FROM dbo.Ch1_TransCount_KPI_vw
    UNION
    SELECT '2' AS SO, Measure, TYtd, LYtd,
            CASE WHEN [TYtd] < [LYtd] THEN '<i class="icon-thumbs-down"></i>' ELSE '<i class="icon-thumbs-up"></i>' END AS Growth
    FROM dbo.Ch1_Qty_KPI_vw
    UNION
    SELECT '3' AS SO, Measure, TYtd, LYtd,
            CASE WHEN [TYtd] < [LYtd] THEN '<i class="icon-thumbs-up"></i>' ELSE '<i class="icon-thumbs-down"></i>' END AS Growth
    FROM dbo.Ch1_Cost_KPI_vw
    UNION
    SELECT '4' AS SO, Measure, ROUND(TYtd, 2) AS TYtd, ROUND(LYtd, 2) AS LYtd,
            CASE WHEN [TYtd] < [LYtd] THEN '<i class="icon-thumbs-down"></i>' ELSE '<i class="icon-thumbs-up"></i>' END AS Growth
    FROM dbo.Ch1_Sales_KPI_vw
    UNION
    SELECT '5' AS SO, Measure, ROUND(TYtd, 2) AS TYtd, ROUND(LYtd, 2) AS LYtd,
            CASE WHEN [TYtd] < [LYtd] THEN '<i class="icon-thumbs-down"></i>' ELSE '<i class="icon-thumbs-up"></i>' END AS Growth
    FROM dbo.Ch1_GP_KPI_vw
) AS utbl
ORDER BY SO
Listing 2. Ch1_Core_KPIs_vw view.

Table 1. Data set returned by the Ch1_Core_KPIs_vw.
Each line in the Table 1 is generated by a separate view. One of them is shown in the Listing 3. This and four other views were combined into the Ch1_Core_KPIs_vw view using SQL UNION Operator. For simplicity I hardcoded the filter values, but it would a small hurdle to use parameterised stored procedures instead of the views. You can try it on your own.
WITH Base AS
(
SELECT TOP (100) PERCENT CASE WHEN YEAR(dbo.Orders.OrderDate) = 1997 THEN 'LYtd' ELSE 'TYtd' END AS Period, COUNT(DISTINCT OrderID) AS TransCount
FROM   dbo.Orders
WHERE  (dbo.Orders.OrderDate BETWEEN '19970101' AND '19970506') OR
       (dbo.Orders.OrderDate BETWEEN '19980101' AND '19980506')
GROUP BY CASE WHEN YEAR(dbo.Orders.OrderDate) = 1997 THEN 'LYtd' ELSE 'TYtd' END
ORDER BY Period
)
SELECT 'TransCount' AS Measure, *
FROM    Base PIVOT (SUM([TransCount]) FOR Period IN ([LYtd], [TYtd])) AS p
Listing 3. An SQL view that generates first line in the Table 1.
|
Listing 4. The HTML snippet generated by the CommonKPI.r R routine.
Now we are ready to build the “ASP.NET bit” of the application.
Presentation Layer
Open Visual Studio (VS) and create a blank solution named R-2-ASP. Right click on the solution name in the Solution Explorer, select Add New Project from the context menu, and choose the ASP.NET MVC 4 template from the Visual C #Web template group. Type Reporting as a name of the project. Select Empty template from the New ASP.NET MVC project template dialog box, make sure that Razor is selected as a View Engine and click OK.

Figure 3. Creating the ASP.NET MVC project.
If the Package Manager Console is not visible at the bottom of the Visual Studio windows, select the VIEW\Other Windows\Package Manager Console menu to make it visible, and then type Install-Package twitter.bootstrap.mvc4. Next, run Install-Package twitter.bootstrap.mvc4.sample command.
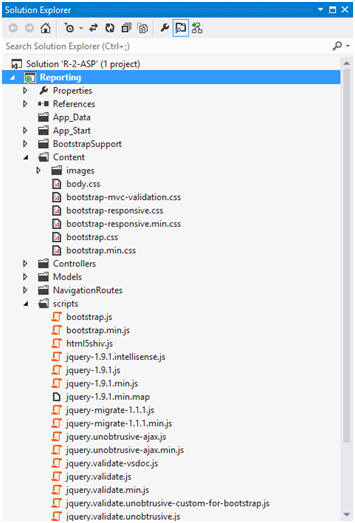
This installation does a lot of work for you. It ‘blends’ Bootstrap package into our MVC4 project, creates navigation menus and default views (although we don’t need them all as we are not implementing any CRUD views) and more. Here is how the VS project’s structure should look like if the installation completed successfully.

Figure 4. ASP.NET MVC project structure.
To create a folder where the R engine will load the HTML files right click on the Content folder, select Add\New Folder from the context menu, and name it as html. The HTML files, generated by R (see Listing 4 e.g.) require some post-processing to remove some redundant mark-up and change the HTML table CSS class to enable the Bootstrap styling and navigation. A custom ASP.NET MVC Helper class would a good option for that. A static method of that class will read our HTML snippet, process it and returns a new HTML string.
Add a new folder named Helpers to the project. Right-click on the new folder and select Add\New Class from the context menu. Name the class as HtmlHelpers.cs. Make this class static and create a static method LoadHtml, which is shown in the Listing 5.
using System.Net;
using System.Web;
using System.Web.Mvc;

namespace Reporting.Helpers
{
	public static class HtmlHelpers
	{
		public static MvcHtmlString LoadHtml(this HtmlHelper html, string file)
		{
			//import html content (file)
			string rawHtml = new WebClient().DownloadString(HttpContext.Current.Server.MapPath(file)).ToString();
			//change CSS class to make it compatible with Bootstrap
			rawHtml = rawHtml.Replace("dataframe", "\'table table-striped table-bordered table-condensed table-hover\'");
			//find the beginning of the inner table and get the portion of the imported content
			//from that position to the end
			int startIdx = rawHtml.IndexOf("
			rawHtml = rawHtml.Substring(startIdx);
			//find the end of the inner table and remove the tale after the end
			int endIdx = rawHtml.IndexOf("

".Length;
			string innerTbl = rawHtml.Substring(0, endIdx);
			//return the inner html table to the view
			return MvcHtmlString.Create(innerTbl);
		}
	}
}
Listing 5. Custom HTML Helper class.
Next, we need to modify the Home Controller by removing some redundant code generated during the Bootstrap package installation. Make sure that the home controller looks like on the Listing 6 below.
using System.Web.Mvc;
namespace BootstrapMvcSample.Controllers
{
  public class HomeController : BootstrapBaseController
  {
    public ActionResult Index()
    {
      return View();
    }
  }
}
Listing 6. Modified HomeController.cs file
The last step is to edit the default Index View as follows (see Listing 7).
@using Reporting.Helpers;
@{ViewBag.Title = "Index";}
Above all else show the data. The Visual Display of Quantitative Information
Listing 7. Index View code
CSS classes ‘container-fluid’, ‘row-fluid’, etc. that you can see inside the Index view are used by bootstrap.css to set up a fluid Bootstrap grid. In this case, it contains two rows and two columns. The ‘span6′ CSS class specifies the grid’s columns. The default Bootstrap grid system utilizes 12 columns and span6 indicates that each of the columns uses 50% of the space. For more information, open this link.
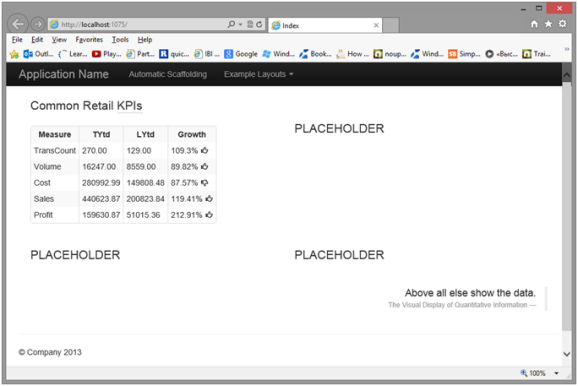
Now return into R console and from the command prompt type source(‘coreKPI.r’). This command will create coreKPI.html snippet and save it in the Content\html folder of the ASP.NET MVC Reporting project. Return to Visual Studio and hit F5 to run and see the first report as shown below

Figure 5. First Report.
In the following blog posts, we will continue building the remaining reports and make some changes to the user interface.
R-bloggers.com offers daily e-mail updates about R news and tutorials about learning R and many other topics. Click here if you're looking to post or find an R/data-science job.
Want to share your content on R-bloggers? click here if you have a blog, or here if you don't.
