February 2013

Clustering Loss Development Factors

February 15, 2013 | PirateGrunt

  Anytime I get a new hammer, I waste no time in trying to find something to bash with it. Prior to last year, I wouldn’t have known what a cluster was, other than the first half of a slang term used to describe a poor decision-making process. Now I’... [Read more...]

Sorting rows and colums in a matrix (with some music, and some magic)

February 14, 2013 | arthur charpentier

This morning, I was working on some paper on inequality measures, and for computational reasons, I had to sort elements in a matrix. To make it simple, I had a rectangular matrix, like the one below, __ set.seed(1) __ u=sample(1:(nc*nl)) __ (M1=matrix(u,nl,nc)) [,1] [,2] [,3] [,4] [,5] [,6] [1,] 7 5 11 23 6 17 [2,] 9 18 1 21 24 15 [3,] 13 19 3 8 22 2 [4,] 20 12 14 16 4 10 I had to ... [Read more...]

January Seasonality Shiny web application

February 14, 2013 | systematicinvestor

Today, I want to share the January Seasonality application (code at GitHub). This example is based on the An Example of Seasonality Analysis post. This is the third application in the series of examples (I plan to share 5 examples) that will demonstrate the amazing Shiny framework and Systematic Investor Toolbox ... [Read more...]

Make a Valentine’s Heart with R

February 14, 2013 | David Smith

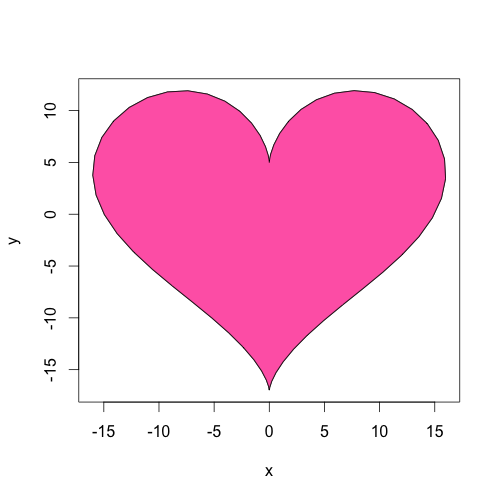
If you haven't sent your loved one a Valentine's Day greeting yet, it's not too late! Thanks to Guillermo Santos who pointed out an R script from Berkeley's Concepts in Computing with Data course, I created the following Valentine's Day card for my husband: If you want to make one ... [Read more...]

GPS Basemaps in R Using get_map

February 14, 2013 | Mollie

There are many different maps you can use for a background map for your gps or other latitude/longitude data (i.e. any time you're using geom_path, geom_segment, or geom_point.)get_mapHelpfully, there's just one function that will allow you to query Google Maps, OpenStreetMap, Stamen maps, ... [Read more...]

Veterinary Epidemiologic Research: Linear Regression

February 14, 2013 | denishaine

This post will describe linear regression as from the book Veterinary Epidemiologic Research, describing the examples provided with R. Regression analysis is used for modeling the relationship between a single variable Y (the outcome, or dependent variable) measured on a continuous or near-continuous scale and one or more predictor (independent ... [Read more...]

Population simulation leads to Valentine’s Day a[R]t

February 14, 2013 | Matt Asher

Working on a quick-and-dirty simulation of people wandering around until they find neighbors, then settling down. After playing with the coloring a bit I arrived at the above image, which I quite like. Code below: # Code by Matt Asher for statisticsblog.com # Feel free to modify and redistribute, but please ... [Read more...]

R database interfaces

February 14, 2013 | Patrick Burns

Several packages on CRAN provide (or relate to) interfaces between databases and R.  Here is a summary, mostly in the words of the package descriptions.  Remember that package names are case-sensitive. The packages that talk about being DBI-compliant are referring to the DBI package (see below in “Other SQL”). MySQL ... [Read more...]

Getting a simple tree via NCBI

February 14, 2013 | Recology - R

I was just at the Phylotastic hackathon in Tucson, AZ at the iPlant facilities at the UofA. A problem that needs to be solved is getting the incrasingly vast phylogenetic information to folks not comfortable building their own phylogenies. Phylomatic has made this super easy for people that want plant ...
[Read more...]

Version 1.0 of multilevelPSA Available on CRAN

February 14, 2013 | Jason Bryer

Version 1.0 of multilevelPSA has been released to CRAN. The multilevelPSA package provides functions to estimate and visualize propensity score models with multilevel, or clustered, data. The graphics are an extension of PSAgraphics package by Helmreich and Pruzek. The example below will investigate the differences between private and public school internationally ... [Read more...]

Apply Yourself !

February 13, 2013 | steve

Hello. Welcome to my debut post ! Check the About link to see what this Blog intends to accomplish. In this article I discuss a general approach for dealing with the problem of splitting a data frame based on a grouping variable and then doing some more operations per group. A ... [Read more...]

Multiple Stocks Plot Shiny web application

February 13, 2013 | systematicinvestor

Today, I want to share the Multiple Stocks Plot application (code at GitHub). This is the second application in the series of examples (I plan to share 5 examples) that will demonstrate the amazing Shiny framework and Systematic Investor Toolbox to analyze stocks, make back-tests, and create summary reports. The motivation ... [Read more...]

In case you missed it: January 2103 Roundup

February 13, 2013 | David Smith

In case you missed them, here are some articles from January of particular interest to R users. Anthony Damico created an amusing and useful flowchart for finding resources for learning R, especially for survey analysis. All R users: please be counted for the 2013 Rexer Data Miner Survey (R was the #1 ... [Read more...]

Out-of-sample one-step forecasts

February 13, 2013 | Rob J Hyndman

It is common to fit a model using training data, and then to evaluate its performance on a test data set. When the data are time series, it is useful to compute one-step forecasts on the test data. For some reason, this is much more commonly done by people trained ... [Read more...]
1 6 7 8 9 10 15

Never miss an update!
Subscribe to R-bloggers to receive
e-mails with the latest R posts.
(You will not see this message again.)

Click here to close (This popup will not appear again)