
NIT: Fatty acids study in R – Part 003
[This article was first published on NIR-Quimiometría, and kindly contributed to R-bloggers]. (You can report issue about the content on this page here)
Want to share your content on R-bloggers? click here if you have a blog, or here if you don't.
Want to share your content on R-bloggers? click here if you have a blog, or here if you don't.
As I told you I´m a beginner in “R”, so I realize that I have to prepare my data a little bit in order to continue from my previous post ( NIT: Fatty acids study in R – Part 002) after getting some errors.
Anyway I´m really fascinated with this program, so sorry if I make some confusion.
Anyway I´m really fascinated with this program, so sorry if I make some confusion.
> fattyac_msc<-data.frame(C16_0=I(C16_0),C16_1=I(C16_1),C18_0=I(C18_0),
+ C18_1=I(C18_1),C18_2=I(C18_2),C18_3=I(C18_3),NITmsc=I(fat_msc))
> names(fattyac_msc)
[1] “C16_0” “C16_1” “C18_0” “C18_1” “C18_2” “C18_3” “NITmsc”
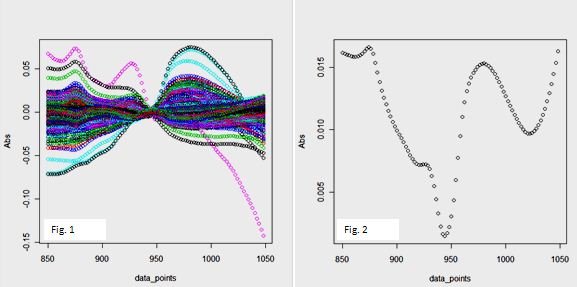
Let´s plot the X (spectra) matrix treated with MSC and centered (Fig 1)
> fattyac_msc_c<-scale(fattyac_msc$NITmsc,center = TRUE,scale = FALSE)
> matplot(wavelengths,t(fattyac_msc_c),lty=1,pch=21,
+ xlab=”data_points”,ylab=”Abs”)
Let´s plot the X (spectra) Standard Deviation Spectrum of this centered matrix (Fig 2)
> sdfattyac_msc_c<-sd(fattyac_msc_c)
> matplot(wavelengths,sdfattyac_msc_c,lty=1,pch=21,
+ xlab=”data_points”,ylab=”Abs”)
Let´s have a look again to the original spectra treated with MSC:

It is clear the sample which has a high MD (Mahalanobis Distance) value, a clear outlier. We will see, which characteristics has this sample (along this study) and if it should be excluded or maintained for the calibration
We saw the scores in the previous post, let´s have a look to the loadings.
> fatmsc_nipalsP4pc<-fatmsc_nipals$P[,1:4]
> loading1<-fatmsc_nipalsP4pc[,1]
> loading2<-fatmsc_nipalsP4pc[,2]
> loading3<-fatmsc_nipalsP4pc[,3]
> loading4<-fatmsc_nipalsP4pc[,4]
> loading4<-fatmsc_nipalsP4pc[,4]

It is interesting to find interpretation to these plots, for this is important to look carefully to all the plots (scores,loadings, original spectra,…), and also to consult bibliography about the position of the NIT bands for C-H, O-H,.., bonds.
To leave a comment for the author, please follow the link and comment on their blog: NIR-Quimiometría.
R-bloggers.com offers daily e-mail updates about R news and tutorials about learning R and many other topics. Click here if you're looking to post or find an R/data-science job.
Want to share your content on R-bloggers? click here if you have a blog, or here if you don't.