Open repo of ecological data for use in teaching
Just a quick announcement. I’ve organized and posted two ecological datasets that I find helpful for creating examples for teaching. The repo and instructions for use and attribution are on github:
htt... [Read more...]
Introduction
I was interested to see whether and how well R would run on the new RISC-V architecture.
A while ago I read that RISC-V is now a
first class architecture for Ubuntu.
This got me thinking, instead of having to build R from source maybe the...
At Jumping Rivers, we believe training should be more than just a tick-box exercise. It should be transformative. Whether you’re learning R, Python, SQL, Git or Posit for the first time or diving into advanced topics like machine learning and Qua...
Another in an accidental series of “Basic facts about U.S. urban areas presently in the news”. This week, West Coast Edition: like other very large American cities, Los Angeles is very big.
There are a lot of Angelenos.
... [Read more...]
Just a quick announcement. I’ve organized and posted two ecological datasets that I find helpful for creating examples for teaching. The repo and instructions for use and attribution are on github:
https://github.com/cbrown5/example-ecological-d... [Read more...]
In a world where large language models are the first point of contact, your website needs to speak to them as much as it does to your users. Here's how analytics teams can help rewire the funnel. [Read more...]
Interpolation in the Frequency Domain Improved!
Interpolation in the Frequency Domain
Improved!
Introduction
This post describes interpolation in the frequency domain (IFD) and
an improvement to IFD. IFD is a method of interpolation that is easy to
use and produces good results on most time series data (data samples
equally ...
Vibe coding with AI agents is not for scientists
Vibe coding is the idea of creating software with large language models (e.g. chat GPT, Claude), using only prompting and no, or very little human written code.
Co-founder of openAI says of vibe coding... [Read more...]
Vibe coding is the idea of creating software with large language models (e.g. chat GPT, Claude), using only prompting and no, or very little human written code.
Co-founder of openAI says of vibe coding: “It’s not really coding - I just see ... [Read more...]
Do ‘fragile’ p values tell us anything?
I was interested recently to see this article on p values in the psychology literature float across my social media feed. Paul C Bogdan makes the case that the severity of the replication crisis in science can be...
Adding images to a web page used to be straightforward. You’d add the img tag to the HTML, set the src attribute to the appropriate URL and, hopefully, write some informative alt text. (You might also add some CSS, either inline or via a styles...
It’s plot recreation time! In this post, we’ll look at how we can recreate a plot in R. I thought it might be useful to provide the solution but also to detail the process I went through to get there. We have a FACS plot taken from a ...
Read it in: Español. We are excited to introduce the new team of mentors for the rOpenSci Champions Program! This year, we have ten very talented individuals, all from Latin America, who bring a unique combination of experience, enthusiasm, and commit... [Read more...]
1 Introduction
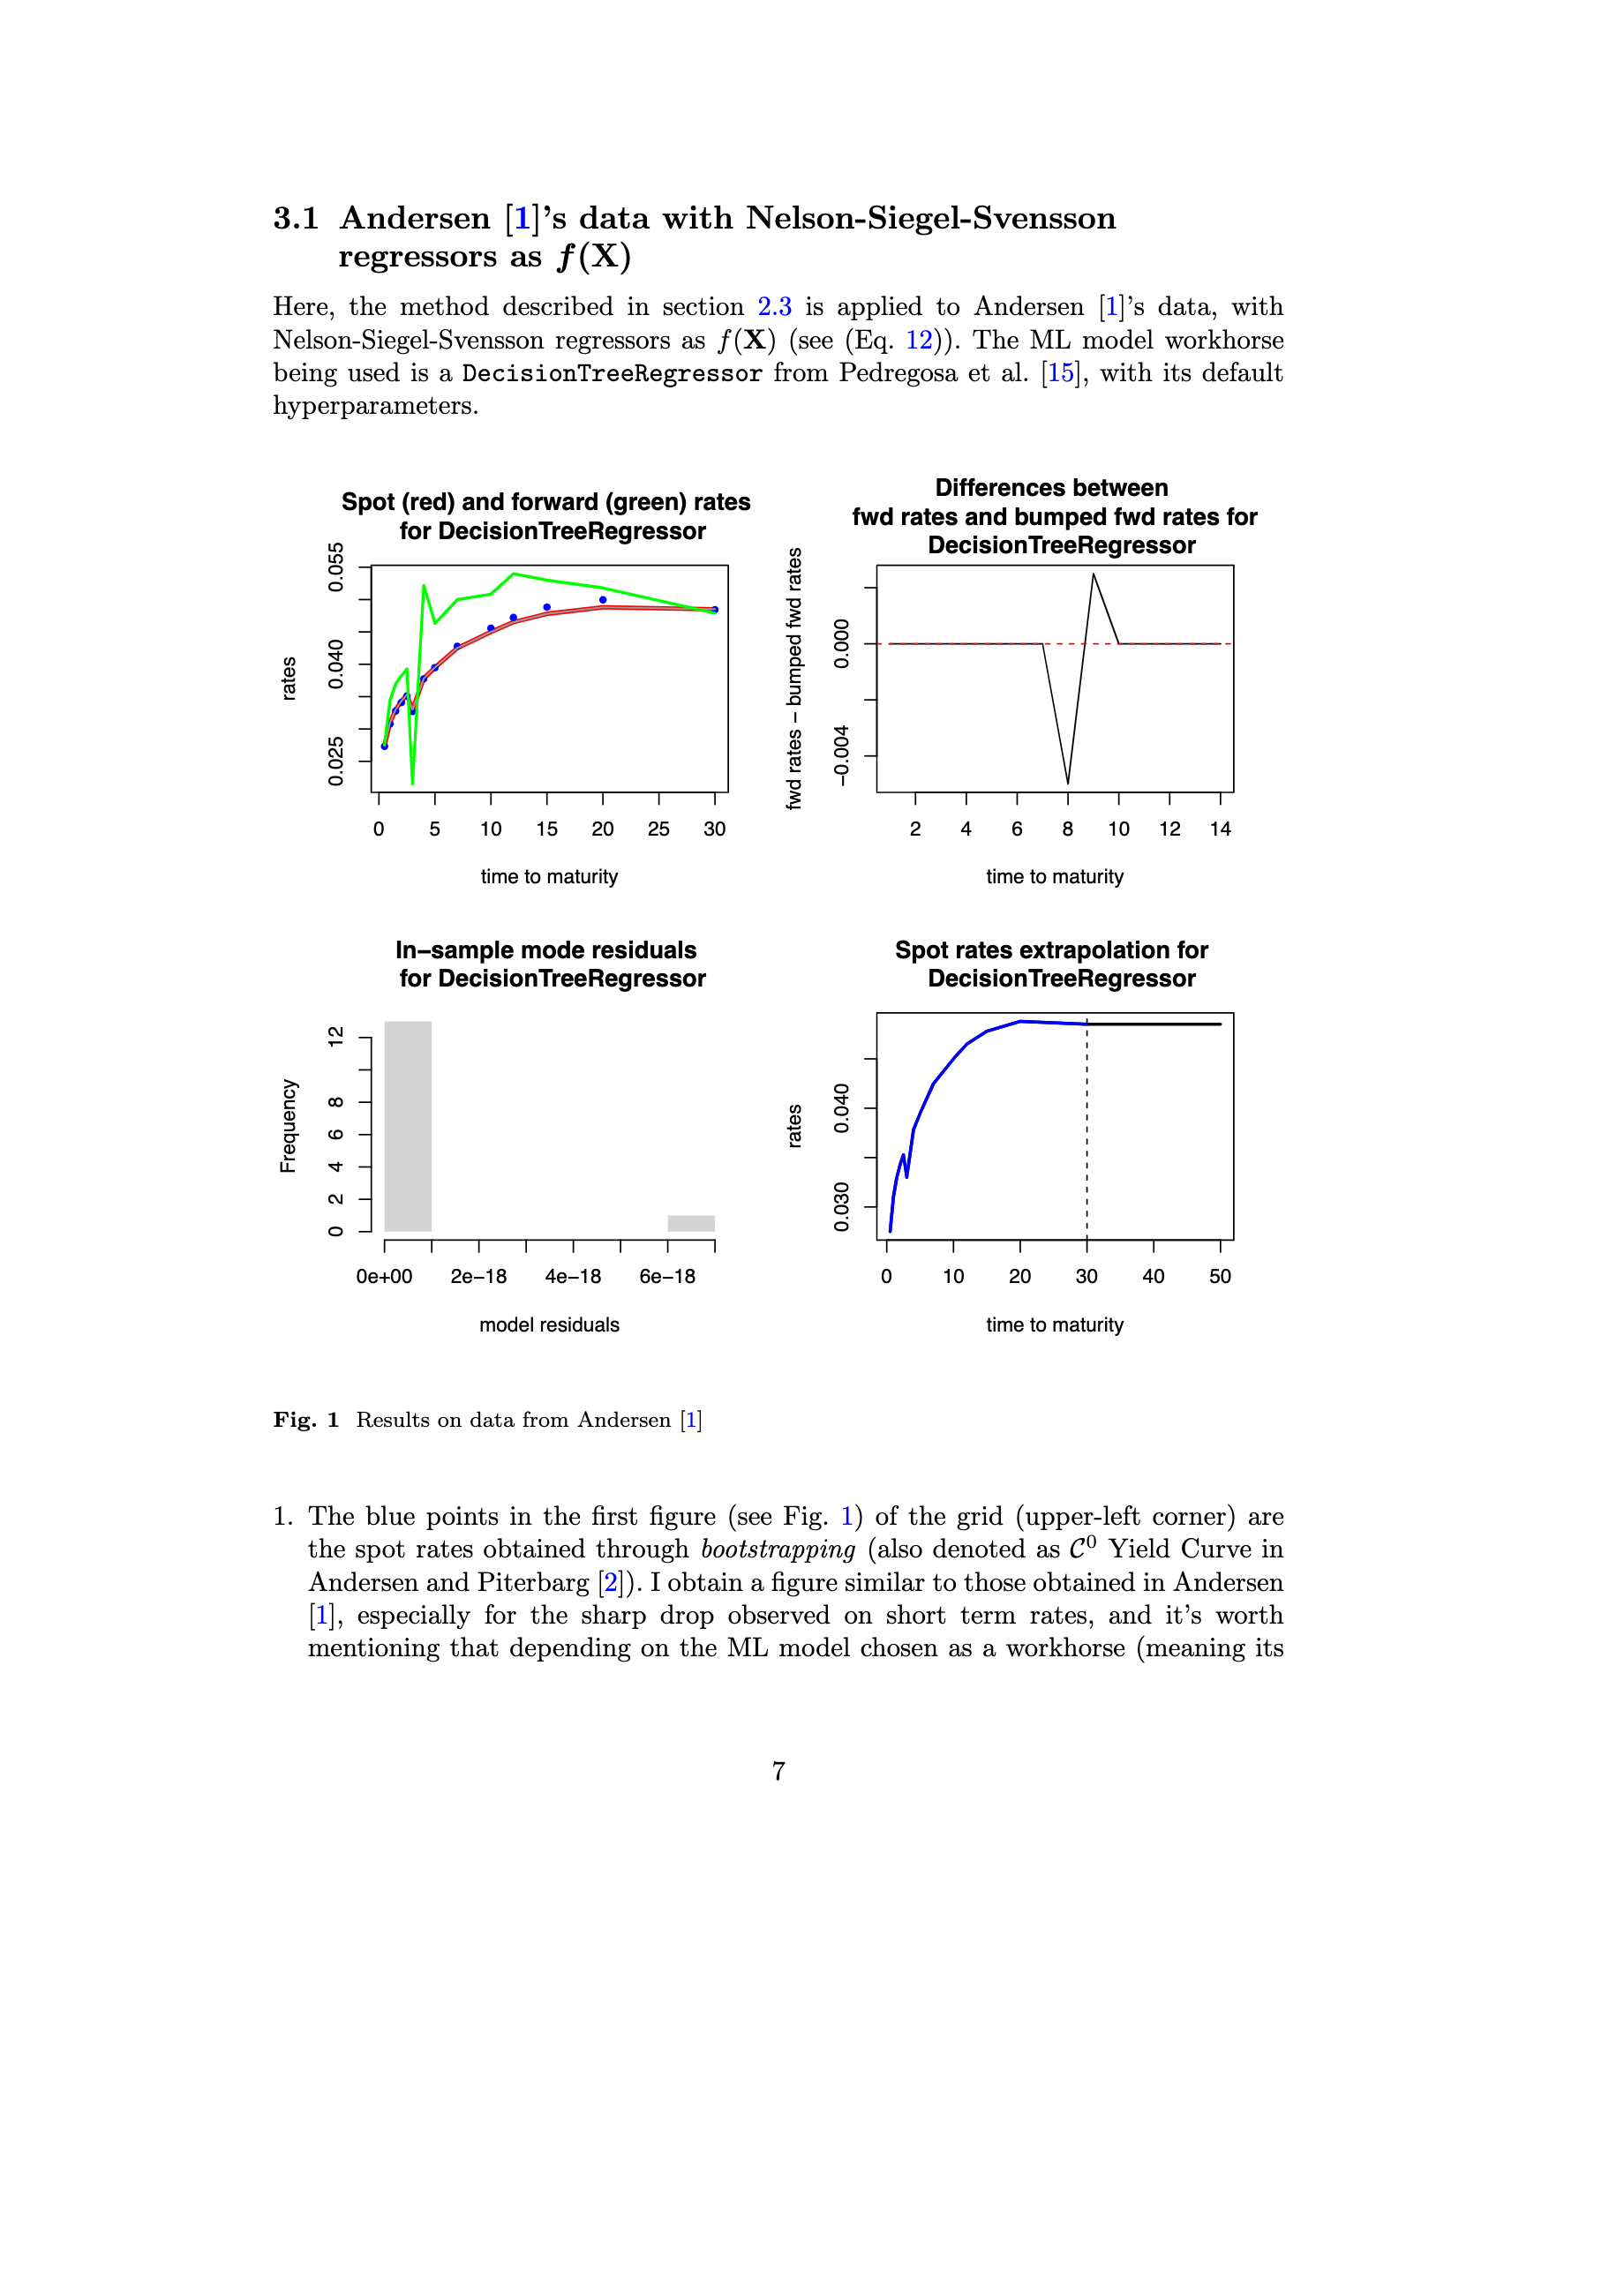
“Correlation is not causation” – it’s a refrain we hear often, yet the distinction between these concepts is deceptively easy to overlook. Correlation refers to a statistical association: when one variable changes, another ...