
Geomorph 3D Visualization
[This article was first published on geomorph, and kindly contributed to R-bloggers]. (You can report issue about the content on this page here)
Want to share your content on R-bloggers? click here if you have a blog, or here if you don't.
Dear geomorph users,Want to share your content on R-bloggers? click here if you have a blog, or here if you don't.
version 2.0 of geomorph brings new developments in how shape deformations from 3D coordinate shape data can be viewed. We have implemented warping of 3D surface files (e.g., .ply files), which allows the user to visualize the shape deformations along Principal Component axes, Multivariate Regression slopes, Partial Least Squares axes and group differences, to name a few.
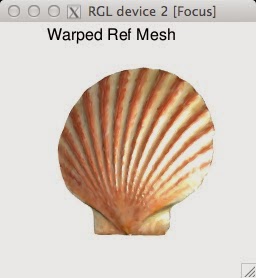
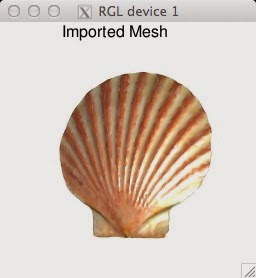
The new function warpRefMesh() reads in a .ply file and landmark coordinates associated with this specimen, and uses the thin-plate spline method (Bookstein 1989) to warp the mesh into the shape defined by a second set of landmark coordinates, usually
those of the mean shape for a set of aligned specimens.
When using this function for warping, it is highly recommended that the mean shape (derived from the users sample using mshape()) is used as the reference for warping (see Rohlf 1998).
The workflow is as follows:
1. Calculate the mean shape using mshape()
2. Choose an actual specimen to use for the warping – the specimen used as the template for this warping is recommended to be one most similar in shape to the average of the sample, but can be any reasonable specimen – do this by eye, or use findMeanSpec()
3. Warp this specimen into the mean shape using warpRefMesh()
4. Use this average mesh where it asks for a mesh= in the analysis functions and visualization functions (plotTangentSpace(), plotAllometry(), bilat.symmetry(), and plotRefToTarget()).
> ref <- mshape(data)
> refmesh <- warpRefMesh("plyfile.ply", data[,,1], ref, color=NULL, centered=T) # here the digitized coordinates for specimen plyfile are the first in the array
warpRefMesh plots the imported mesh (below left) and the new warped mesh that represents the ref shape (mean shape, below right):
The function also returns to object refmesh a mesh3d object of this new warped mesh, which can be used in any function in geomorph where mesh= is an option. For example,
> plotTangentSpace(data, axis1 = 1, axis2 = 2, warpgrids=T, mesh= refmesh)
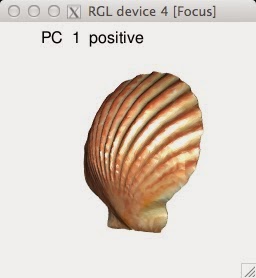
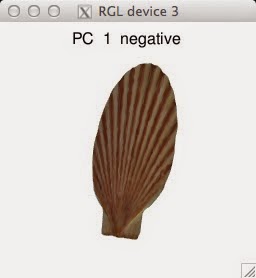
Here, we see that function plotTangentSpace returns the shape deformation matching the most negative and most positive shape along the axis specified in axis1=.
The warping capabilities in geomorph are similar to those done using IDAV Landmark (e.g., Drake and Klingenberg 2010), but of course the benefit is that now all your analyses and visualizations can be done in R.
Emma
To leave a comment for the author, please follow the link and comment on their blog: geomorph.
R-bloggers.com offers daily e-mail updates about R news and tutorials about learning R and many other topics. Click here if you're looking to post or find an R/data-science job.
Want to share your content on R-bloggers? click here if you have a blog, or here if you don't.