January 2013

Loss reserving has a new, silly name

January 18, 2013 | PirateGrunt

I started using Git some time ago, but mostly for local work files. Today, I finally sync’ed up a repository for loss reserving analysis. It may be found here: https://github.com/PirateGrunt/MRMR MRMR stands for Multivariate Regression Model for Reserves. When pronounced “Mister Mister” it also sounds ... [Read more...]

Safely Loading Packages in R

January 18, 2013 | Tony

Using R snippets written by other developers can be unendingly maddening.  There are a variety of reasons for this, most of which boil down to a simple issue: most code is written such that a system must be configured in … Continue reading → [Read more...]

How much can we learn from an empirical result? A Bayesian approach to power analysis and the implications for pre-registration.

January 18, 2013 | Justin Esarey

Just like a lot of political science departments, here at Rice a group of faculty and students meet each week to discuss new research in political methodology. This week, we read a new symposium in Political Analysis about the pre-registration of studies in political science. To briefly summarize, several researchers ... [Read more...]

Visually Comparing Return Distributions

January 18, 2013 | Peter Carl

Here is a spot of code to create a series of small multiples for comparing return distributions. You may have spotted this in a presentation I posted about earlier, but I’ve been using it here and there and am finally satisfied that it is a generally useful view, so ... [Read more...]

Choosing colors visually with ‘getcolors’

January 18, 2013 | Marc in the box

When plotting, I am constantly defaulting to the "main" colors in R - In other words, the colors that one can quickly call by number (1="black", 2="red", 3="green", 4="blue", ... etc.) . In my opinion, these colors do not lend themselves well to compelling graphics. I imagine this is the reason for ... [Read more...]

Dynamically annotate graphs with Shiny

January 18, 2013 | Rolf Fredheim

Below I present a simple way to automatically annotate plots through Shiny It occurred to me that labeling plots should be really easy to do with R-studio's swanky 'Shiny' add on. To test this I gathered some time series data from Wikipedia, added opt...
[Read more...]

Using the GSL to compute eigenvalues

January 18, 2013 | Rcpp Gallery

Two posts showed how to compute eigenvalues using Armadillo and using Eigen. As we also looked at using theGNU GSL, this post will show how to conpute eigenvalues using GSL. As mentioned in the previous GSL post, we instantiate C language pointers suitable for GSL (here the matrix M). Those ...
[Read more...]

In case you missed it: December 2012 Roundup

January 17, 2013 | David Smith

In case you missed them, here are some articles from December of particular interest to R users. The blog is.R ran an excellent series of R tips and applications in December, with posts including working with Stata files, working with graphs and networks, and text analysis. Kohske Takahashi provides ... [Read more...]

SHODAN API in R (With Examples)

January 17, 2013 | hrbrmstr

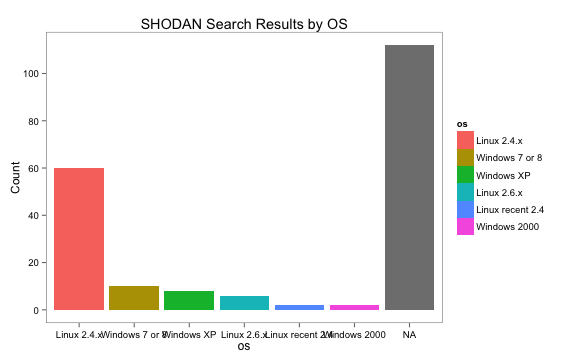
Folks may debate the merits of the SHODAN tool, but in my opinion it’s a valuable resource, especially if used for “good”. What is SHODAN? I think ThreatPost summed it up nicely: “Shodan is a Web based search engine that discovers Internet facing computers, including desktops, servers and routers. ...
[Read more...]

R Gauge Plots

January 17, 2013 | Jeff Hemsley

Gaston Sanchez’s post on R-Bloggers inspired me to waste a bit of time. He wanted to replicate the Google Charts widget to make gauges. I modified his code (below) in some minor ways and made a function out of it so you can alter the look and feel of ... [Read more...]

Maize trade Part I: Generate the network diagram

January 17, 2013 | Michael kao

It has been several month since my last post, partially due to the fact that my laptop was lost and several deadlines was approaching. Fortunately I will be returning to Taiwan and get a new laptop within a week, and will be updating regularly again.This post will provide a ... [Read more...]

Steve Culman on the `plyr` Package

January 17, 2013 | Noam Ross

At Davis R Users’ Group yesteray, Steve Culman gave us an introduction to the plyr package and how to use it to manipulate data. Here’s his presentation, and the accompanying demonstration script: Steve’s talk is based on this paper by Hadley Wickham in the Journal of Statistical Software. ... [Read more...]

Creating xts objects from source

January 17, 2013 | Rcpp Gallery

A recent post showed how to access the attributes of an xts object. We used an xts object as these are powerful and popular—but any R object using attributed could be used to illustrate the point. In this short post, we show how one can also do the inverse ...
[Read more...]

Project Euler — problem 25

January 16, 2013 | Tony

Finally, the fog lasting for days went away this morning and the sun comes out. It’s a lovely winter day. After taking a walk after lunch, I feel like doing some math. So, here comes the 25th Euler problem. The … Continue reading → [Read more...]

Optimal number of clusters

January 16, 2013 | systematicinvestor

In the last post, Examples of Current Major Market Clusters, we looked at clustering Major Markets into 4 groups based on their correlations in 2012. Today, I want to continue with clustering theme and discuss methods of selecting number of clusters. I will look at the following methods of selecting optimal number ... [Read more...]
1 6 7 8 9 10 17

Never miss an update!
Subscribe to R-bloggers to receive
e-mails with the latest R posts.
(You will not see this message again.)

Click here to close (This popup will not appear again)