
Updated Circular Plots for Directional Bilateral Migration Data
Want to share your content on R-bloggers? click here if you have a blog, or here if you don't.
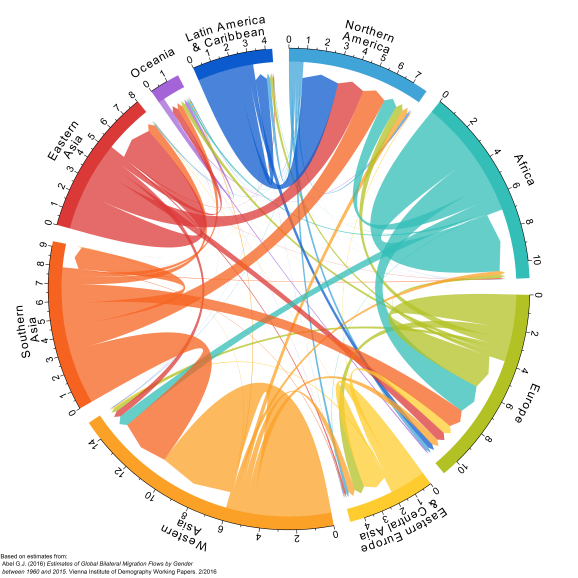
I have had a few emails recently regarding plots from my new working paper on global migration flows, which has received some media coverage here, here and here. The plots were created using Zuguang Gu’s excellent circlize package and are modified version of those discussed in an earlier blog post. In particular, I have made four changes:
- I have added arrow heads to better indicate the direction of flows, following the example in Scientific American.
- I have reorganized the sectors on the outside of the circle so that in each the outflows are plotted first (largest to smallest) followed by the inflows (again, in size order). I prefer this new layout (previously the inflows were plotted first) as it allows the time sequencing of migration events (a migrant has to leave before they can arrive) to match up with the natural tendency for most to read from left to right.
- I have cut out the white spaces that detached the chords from the outer sector. To my eye, this alteration helps indicate the direction of the flow and gives a cleaner look.
- I have kept the smallest flows in the plot, but plotted their chords last, so that the focus is maintained on the largest flows. Previously smaller flows were dropped according to an arbitrary cut off, which meant that the sector pieces on the outside of the circle no longer represented the total of the inflows and outflows.
Combined, these four modifications have helped me when presenting the results at recent conferences, reducing the time I need to spend explaining the plots and avoiding some of the confusion that occasionally occurred with the direction of the migration flows.
If you would like to replicate one of these plot, you can do so using estimates of the minimum migrant transition flows for the 2010-15 period and the demo R script in my migest package;
# install.packages("migest")
# install.packages("circlize")
library("migest")
demo(cfplot_reg2, package = "migest", ask = FALSE)
which will give the following output:
The code in the demo script uses the chordDiagram function, based on a recent update to the circlize package (0.3.7). Most likely you will need to either update or install the package (uncomment the install.packages lines in the code above).
If you want to view the R script in detail to see which arguments I used, then take a look at the demo file on GitHub here. I provide some comments (in the script, below the function) to explain each of the argument values.
Save and view a PDF version of the plot (which looks much better than what comes up in my non-square RStudio plot pane) using:
dev.copy2pdf(file = "cfplot_reg2.pdf", height=10, width=10)
file.show("cfplot_reg2.pdf")

R-bloggers.com offers daily e-mail updates about R news and tutorials about learning R and many other topics. Click here if you're looking to post or find an R/data-science job.
Want to share your content on R-bloggers? click here if you have a blog, or here if you don't.