
The Return of Free Data and Possible Volatility Trading Subscription
Want to share your content on R-bloggers? click here if you have a blog, or here if you don't.
This post will be about pulling free data from AlphaVantage, and gauging interest for a volatility trading subscription service.
So first off, ever since the yahoos at Yahoo decided to turn off their free data, the world of free daily data has been in somewhat of a dark age. Well, thanks to http://blog.fosstrading.com/2017/10/getsymbols-and-alpha-vantage.html#gpluscommentsJosh Ulrich, Paul Teetor, and other R/Finance individuals, the latest edition of quantmod (which can be installed from CRAN) now contains a way to get free financial data from AlphaVantage since the year 2000, which is usually enough for most backtests, as that date predates the inception of most ETFs.
Here’s how to do it.
First off, you need to go to alphaVantage, register, and https://www.alphavantage.co/support/#api-keyget an API key.
Once you do that, downloading data is simple, if not slightly slow. Here’s how to do it.
require(quantmod)

getSymbols('SPY', src = 'av', adjusted = TRUE, output.size = 'full', api.key = YOUR_KEY_HERE)
And the results:
> head(SPY)
           SPY.Open SPY.High SPY.Low SPY.Close SPY.Volume SPY.Adjusted
2000-01-03   148.25   148.25 143.875  145.4375    8164300     104.3261
2000-01-04   143.50   144.10 139.600  139.8000    8089800     100.2822
2000-01-05   139.90   141.20 137.300  140.8000    9976700     100.9995
2000-01-06   139.60   141.50 137.800  137.8000    6227200      98.8476
2000-01-07   140.30   145.80 140.100  145.8000    8066500     104.5862
2000-01-10   146.30   146.90 145.000  146.3000    5741700     104.9448
Which means if any one of my old posts on asset allocation has been somewhat defunct thanks to bad yahoo data, it will now work again with a slight modification to the data input algorithms.
Beyond demonstrating this routine, one other thing I’d like to do is to gauge interest for a volatility signal subscription service, for a system I have personally started trading a couple of months ago.
Simply, I have seen other websites with subscription services with worse risk/reward than the strategy I currently trade, which switches between XIV, ZIV, and VXX. Currently, the equity curve, in log 10, looks like this:
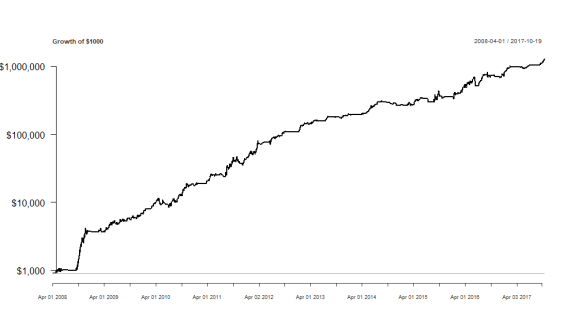
That is, $1000 in 2008 would have become approximately $1,000,000 today, if one was able to trade this strategy since then.
Since 2011 (around the time of inception for XIV), the performance has been:
                        Performance
Annualized Return         0.8265000
Annualized Std Dev        0.3544000
Annualized Sharpe (Rf=0%) 2.3319000
Worst Drawdown            0.2480087
Calmar Ratio              3.3325450
Considering that some websites out there charge upwards of $50 a month for either a single tactical asset rotation strategy (and a lot more for a combination) with inferior risk/return profiles, or a volatility strategy that may have had a massive and historically record-breaking drawdown, I was hoping to gauge a price point for what readers would consider paying for signals from a better strategy than those.
Thanks for reading.
NOTE: I am currently interested in networking and am seeking full-time opportunities related to my skill set. My LinkedIn profile can be found here.

R-bloggers.com offers daily e-mail updates about R news and tutorials about learning R and many other topics. Click here if you're looking to post or find an R/data-science job.
Want to share your content on R-bloggers? click here if you have a blog, or here if you don't.