
Strategy 1 Extended (Part 1)
Want to share your content on R-bloggers? click here if you have a blog, or here if you don't.
Like I said in my previous post, there are two ways I could think of, off the top of my head, to implement a 2-day or 5-day extension to the previous strategy. One way would be just a simple extension of the approach above, using multiple conditions in the if-else statement with lagged vectors. This is how I will solve it here.
The second method, and one that I would be more comfortable with, is just coding it using a for loop and if statements. Its pretty straightforward if you know even the very basics of coding, and if you do, you can probably figure it out on your own.
I tried stringing together a bunch of ‘and’ conditions but it didn’t seem to work. This is what I had typed in:
binVec3Day=ifelse(((Cl(SPY)>Op(SPY)) && (lag(Cl(SPY),1)>lag(Cl(SPY),1)) && (lag(Cl(SPY),2)>lag(Op(SPY),2))),1,0)
So I just replace the ‘&&’ operator with the multiplication operator, and strung the whole thing together with multiple ifelse statements. Here is what I had:
binVec3Day=ifelse(((Cl(SPY)>Op(SPY))),1,0) * ifelse(lag(Cl(SPY),1)>lag(Op(SPY),1),1,0) * ifelse(lag(Cl(SPY),2)>lag(Op(SPY),2),1,0)
Now we need to lag the trading signal vector by a day and get rid of the two NAs which have shown up for our first two days (as it is impossible to know how to trade on the first three days if you need three days of historical data for a trading signal). This is easily done by:
binVec3Day=lag(binVec3Day,1)
binVec3Day[is.na(binVec3Day)]=0
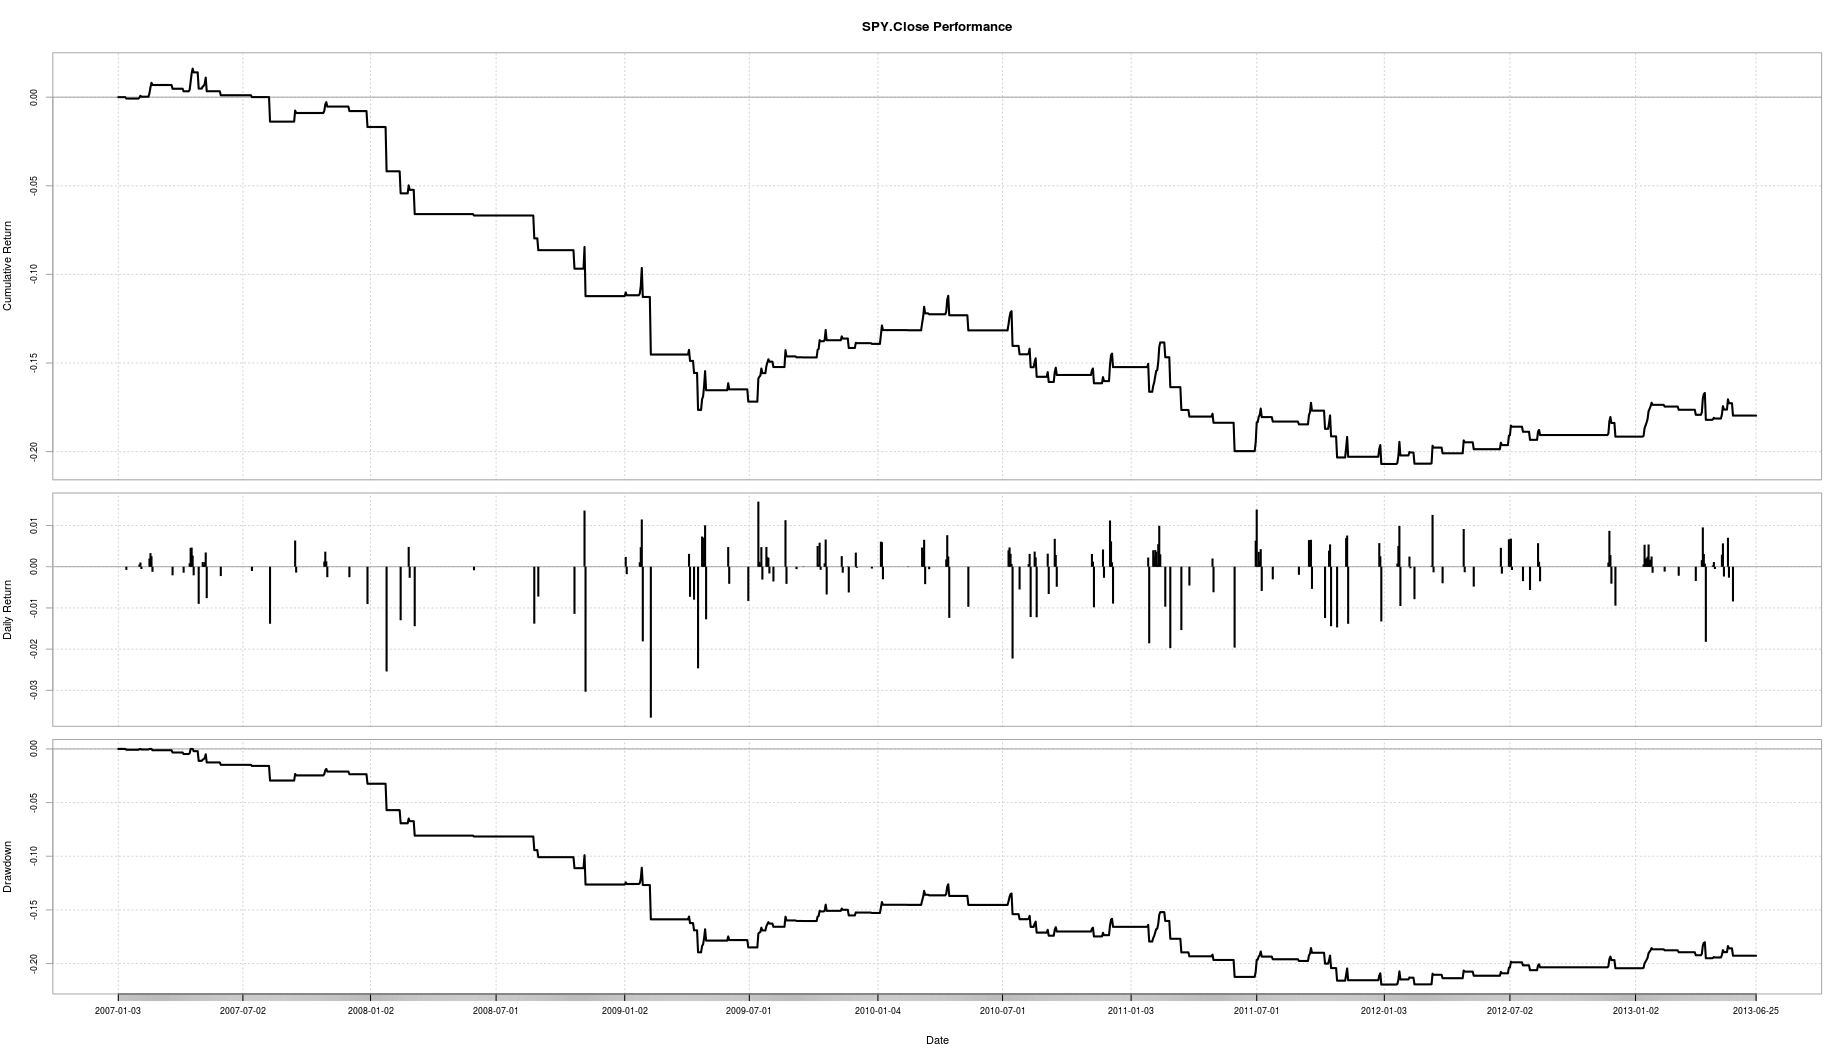
Out of curiosity, I ran sum(binVec3Day) to see how many trades in total there would be from Jan 1st 2007 to now, June 18 2013, using this strategy. The total came out to 230, which brings me to another very important point. The tests I am conducting now do not include transaction costs or an allowance for slippage. Slippage refers to not getting exactly the price required for the trade. These costs can have a significant impact on strategy returns and I will incorporate them into my strategies later on.
Multiplying by the returns vector and plotting the performance summary, again we see that this strategy did not do too well. This is most likely because our dataset starts from 2007, and thus our strategy has to suffer through the financial crash of 2008. We get a cumulative return from 2007 of approximately -18.00% and an annualized return of approximately -3.00%.
Lets look at a subset of our data, to see if the cumulative returns improve. We can assume an investor decides to enter the market in 2010 using this strategy. To subset our data, we can do this:
rets2010=strat3Day[‘2010-01-01/2013-06-01’]
Now we can plot it using performance summary.

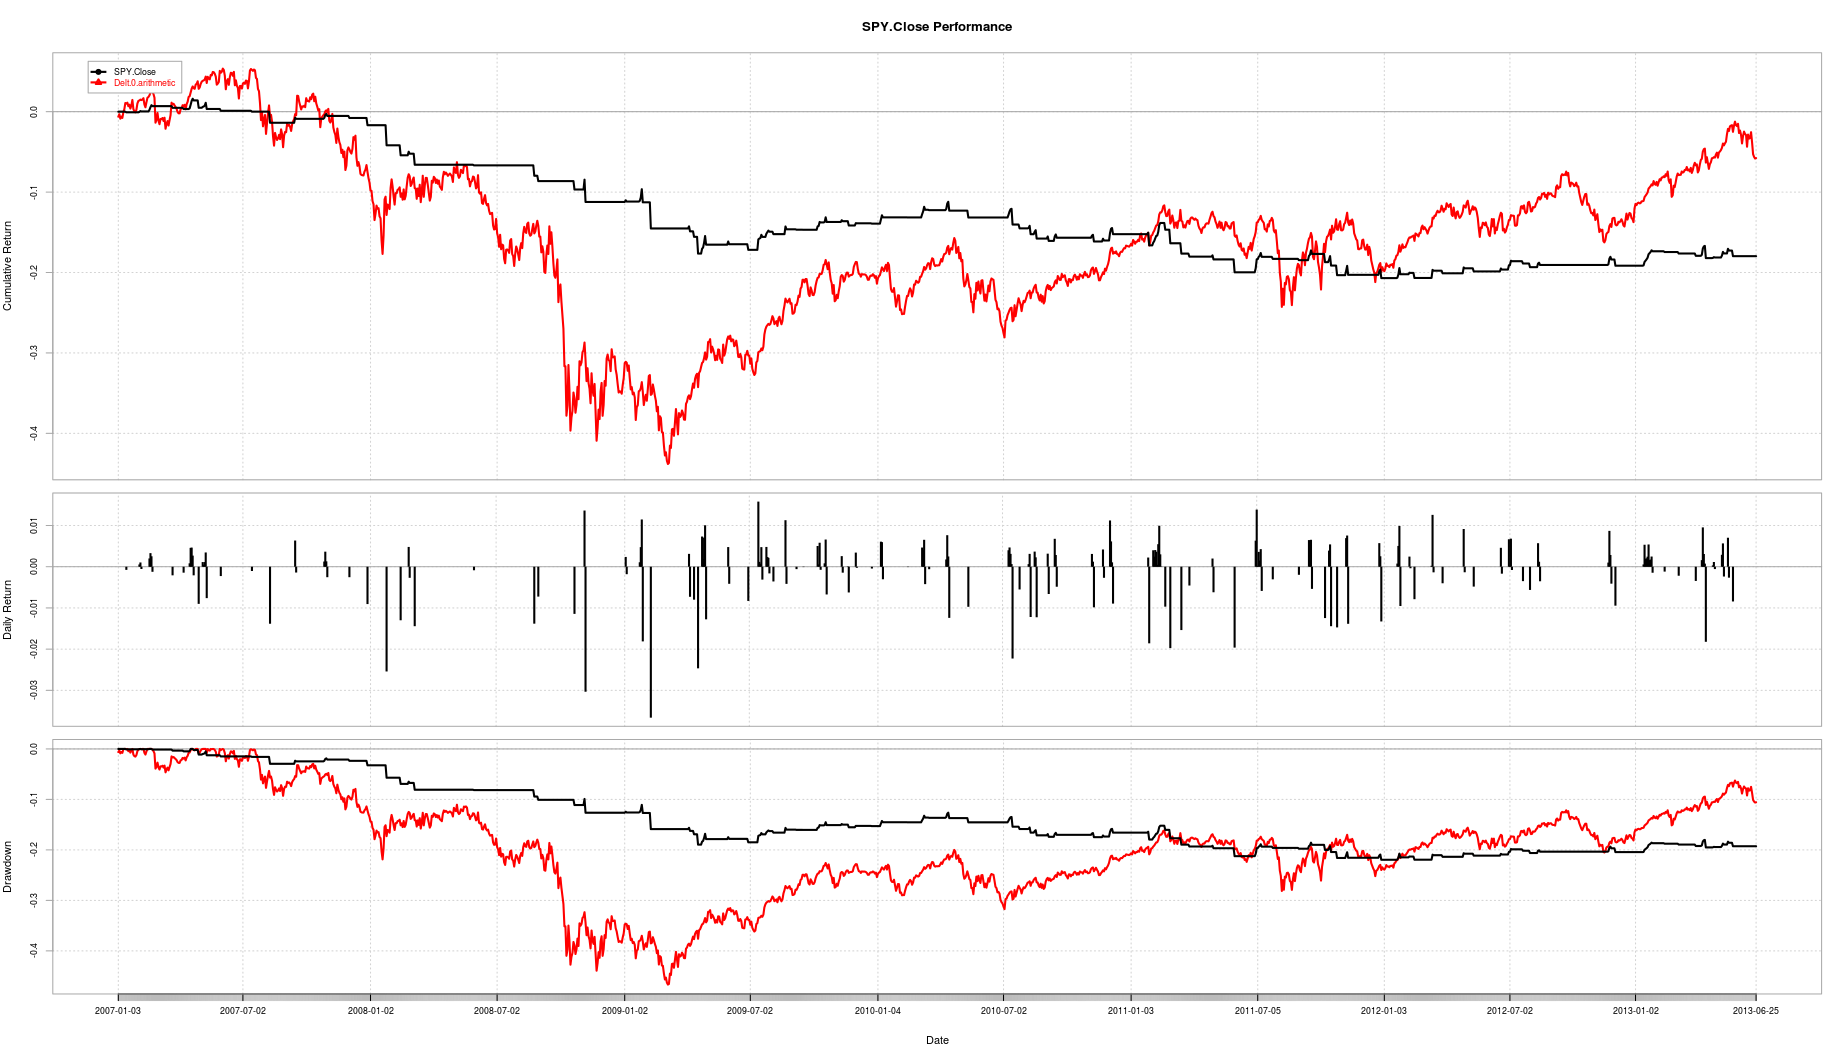
We can combine our strategy’s returns with benchmark returns on the same graph for comparison purposes. This is done by:
combinedReturns=cbind(retVec,Strat3Day)
(cbind actually stands for column bind, and isn’t short for ‘combined’ which you could mistake from my use of variable names above)
Now when we plot combinedReturns using Performance Summary, we can see that it has underperformed the benchmark so far, in terms of cumulative return. Where our strategy stands out though is the reduced drawdown we suffer in down markets. Annualized volatility is reduced from approximately 18.00% to 4.00%. We can’t really use the Sharpe ratio for comparison here as the excess returns are negative.
You can get the annualized Sharpe ratio and volatility for the S&P by entering:
SharpeRatio.annualized(retVec, scale=252)
sd.annualized(retVec, scale=252)
So why are we getting negative cumulative returns? Because the strategy is not in the market enough due to market conditions. Hence the low volatility and negative return. If we can make use of any available big downward moves, we may be able to turn a profit by shorting. Onwards to the next post!

R-bloggers.com offers daily e-mail updates about R news and tutorials about learning R and many other topics. Click here if you're looking to post or find an R/data-science job.
Want to share your content on R-bloggers? click here if you have a blog, or here if you don't.