
Scraping and Plotting Minneapolis Property Prices | RSelenium, ggmap, ggplots
Want to share your content on R-bloggers? click here if you have a blog, or here if you don't.
I recall having once scraped data from a Malaysian property site so that I may be able to plot the monthly rental rates for a specific neighborhood in Selangor. This time I thought it might be interesting to try and plot property prices for a specific region in the United States: Minneapolis.
I settled on a site that seemed to show a reasonable amount of information on property sales, and started working on the code. I came up with the following script which ended up giving me about 6000 rows of information:
#load libraries
library(dplyr)
library(rvest)
library(stringr)
library(RSelenium)

#create an empty vector to be populated later
complete = c(NA)

#From RSelenium
checkForServer() #Check if server file is available
startServer() #Start the server
mybrowser = remoteDriver(browser = "chrome") #Change the browser to chrome
mybrowser$open(silent = TRUE) #Open the browser

#Link to location sub categories
link_main = "site search results page goes here"

#Navigate to the site
mybrowser$navigate(link_main)

#get the web page's html source code
mybrowser$getPageSource()[[1]] %>% html() -> source_main

#scrape all the sub categories and remove unnecessary words
source_main %>% html_nodes(".property-records-content") %>%
  html_nodes("li") %>% html_nodes("a") %>% html_text() %>%
  str_replace_all(pattern = " For Rent", replacement ="") %>%
  str_replace_all(pattern = " For Sale", replacement ="") %>%
  str_replace_all(pattern = " ", replacement = "-") -> Locations

#edit locations to be used in URL
paste(Locations, "state code goes here", sep = "") -> Locations

#first half of the URL to be combined with sub categories
prefix_main = "the site's search results page goes here"

#set maximum number of pages to scrape through. this will be amended in the loop
total_pages = 10

#there are real estate posts for each sub category.
#start loop for each sub category j.
for(j in 1:length(Locations)){ #

#start second loop to go through all posts in each sub category
    for(i in 1:total_pages){
      #create new URL combining sub category, maximum posts per page, and page number
      link = paste(prefix_main, Locations[j], "/pg-", i, "?pgsz=50", sep = "")
      #navigate to this URL
      try(mybrowser$navigate(link))

      #get the html page source for the posts
      try(hLink = html(mybrowser$getPageSource()[[1]]))
      #extract the link to each post in the search results
      hLink %>% html_nodes("#srp-list") %>%
        html_nodes(".srp-item-ldp-link.hidden-xxs.hidden-xs.hidden-sm.hidden-md") %>%
        html_nodes("a") %>% html_attr("href") -> links
      #add extraction results to empty vector created in the beginning
      complete = c(complete, links)
      #extract the total number of real estate posts in the search results,
      #and assign it to the total number pages to scrape through.
      #previous value of total_pages variable was 10.
      hLink %>% html_nodes(".srp-list-footer") %>%
        html_text() %>% str_trim() %>%
        str_replace_all(pattern = "Found ", replacement = "") %>%
        str_replace_all(pattern = " matching properties", replacement = "") %>%
        str_replace_all(pattern = ",", replacement = "") %>% as.integer() -> total_posts

      round(total_posts/50) -> total_pages

    }
  }
#create a new URL prefix
prefix = 'first half of the site goes here"
#links to posts are missing the prefix,
#so to combine them with the all the links that were extracted.
paste(prefix, complete, sep = "") -> complete
#remove the first value of the complete vector because
# the first value is NA
complete[2:length(complete)] -> complete

#create three empty variables, one empty list, and two empty vectors
#these variables will be populated later
details = list()
prices = c()
title = c()

#start the loop that will go through all the posts and
#extract all the details for each real estate post
for(i in 1:length(complete)){
    #navigate to each link saved in the complete variable
    try(mybrowser$navigate(complete[i]))
    #get html source of the page
    try(hLink = html(mybrowser$getPageSource()[[1]]))
    #extract title of the post
    hLink %>% html_nodes(".listing-header") %>%
      html_nodes(".col-xs-7.col-xs-pull-5.col-xxs-12") %>%
      html_nodes("span") %>% html_text() -> title_1
    #collapse all the vector holding the title details and..
    paste(title_1, collapse = " - ") -> title_1
    #..populate the empty vector
    title = c(title, title_1)

    #extract price and populate the empty vector
    hLink %>% html_nodes(".ldp-header-price") %>%
      html_nodes("span") %>% html_text() %>% paste(collapse = "") -> prices_1

    prices = c(prices, prices_1)

    #extract the bed, bath, and sqft details of the property and then..
    #..populating the empty list created earlier
    hLink %>% html_nodes(".property-meta.list-horizontal.list-style-disc.list-spaced") %>%
      html_nodes("li") %>%
      html_text() %>%
      unique() %>% str_replace_all(pattern = "\\n" , replacement = "") %>%
      str_replace_all(pattern = "  ", replacement = "")-> details[[i]]

}

#create an empty dataframe to be populated later
#the number of rows are the total number of links scraped through
#total number of columns are the details needed from each post
matrix(NA, length(complete), 6) %>% data.frame() -> comp_df
#name the columns of the dataframe
names(comp_df) = c("title", "prices", "bed", "bath", "sq_ft", "acres")
#start loop to populate dataframe
for(i in 1:length(complete)){
  #populate the titles
  comp_df[i,"title"] = title[i]
  #populate the prices
  comp_df[i, "prices"] = prices[i]
  #populate beds
  details[[i]] %>% grep(pattern = "bed") -> x
  if(length(x) == 0){comp_df[i, "bed"] = NA}else{comp_df[i, "bed"] = details[[i]][x]}
  #populate baths
  details[[i]] %>% grep(pattern = "bath") -> x
  if(length(x) == 0){comp_df[i, "bath"] = NA}else{comp_df[i, "bath"] = details[[i]][x]}
  #populate sq ft
  details[[i]] %>% grep(pattern = "sq ft") -> x

      if(length(x) == 0){comp_df[i, "sq_ft"] = NA}else{

          if(length(x) != 1){

              grepl("lot", x) -> lot_log

              x[!lot_log] -> x

          }else{comp_df[i, "sq_ft"] = details[[i]][x]}

      }
  #populate acres
  details[[i]] %>% grep(pattern = "acre") -> x
  if(length(x) == 0){comp_df[i, "acres"] = NA}else{comp_df[i, "acres"] = details[[i]][x]}

}
#export final data frame
write.csv(comp_df, "DF_unclean.csv", row.names = FALSE)
The resulting data frame holds the following fields:
Title: The title of the post which shows the region, street address, and zip code of where the property is located.
Prices: The asking price of the property.
Bed: Number of beds
Bath: Number of baths, both full and half.
Sq_ft: The space of the property, in square feet.
Acres: The total number of acres for the whole lot in which the property is situated.
Obviously, the data is not tidy enough to be plotted…so now comes the cleaning:
library(dplyr)
library(stringr)

comp_df -> comp

#remove Prefix from titles
comp[,1] %>% str_replace_all(pattern = "Home For Sale - ", replacement = "") -> titles
comp[,1] = titles

#remove dollar signs and commas
comp[,2] %>%
  str_replace_all(pattern = "\\$", replacement = "") %>%
  str_replace_all(pattern = ",", replacement = "") %>%
  as.integer() -> new_prices

comp[,2] = new_prices

#remove characters and convert to factor
comp[,3] %>%
  str_replace_all(pattern = "beds", replacement = "") %>%
  str_replace_all(pattern = "bed", replacement = "") %>%
  as.factor() -> beds

comp[,3] = beds

comp[,4] %>%
  str_replace_all(pattern = "fullbaths", replacement = "FULL") %>%
  str_replace_all(pattern = "fullbath", replacement = "FULL") %>%
  str_replace_all(pattern = "full", replacement = "FULL") %>%
  str_replace_all(pattern = "halfbaths", replacement = "HALF") %>%
  str_replace_all(pattern = "halfbath", replacement = "HALF") %>%
  str_replace_all(pattern = ",", replacement = " - ") %>%
  str_replace_all(pattern = "baths", replacement = "FULL") %>%
  str_replace_all(pattern = "bath", replacement = "FULL") %>%
  as.character() -> baths

comp[,4] = baths

#square feet
comp[,5] %>%
  str_replace_all(pattern = ",", replacement = "") %>%
  str_replace_all(pattern = " sq ft", replacement = "") %>%
  as.integer() -> sq_ft

comp[,5] = sq_ft

#acres
comp[,6] %>%
  str_replace_all(pattern = " acres lot", replacement = "") %>%
  as.numeric() -> acres_lot

comp[,6] = acres_lot

#split full and half baths
comp$full_baths = NA
comp$half_baths = NA

for(i in 1:nrow(comp)){

  if(grepl(" - ", as.character(comp[i,4]))){

    regexpr(" - ", as.character(comp[i,4]))[[1]][1] -> start

    substr(comp[i,4], start+3, nchar(as.character(comp[i,4]))) -> half_b
    substr(comp[i,4], 0, start - 1) -> full_b

    comp$half_baths[i] = half_b

    comp$full_baths[i] = full_b

  }else{

    comp$full_baths[i] = comp[i,4]

    }
}

#split title into zip code, location, and street address
comp$zip = NA
comp$location = NA
comp$strt_address = NA

for(i in 1:nrow(comp)){

  substr(comp[i,1], nchar(comp[i,1]) - 4, nchar(comp[i,1])) %>%
    as.integer() -> comp$zip[i]

  gregexpr(" - ", as.character(comp[i,1]))[[1]][1][1] -> start
  gregexpr(" - ", as.character(comp[i,1]))[[1]][2] -> end

  substr(comp[i,1], start + 3, end - 1) -> Location

  comp$location[i] = Location

  substr(comp[i,1], 0, start - 1) -> street

  comp$strt_address[i] = street

}

select(comp, location, strt_address, zip, bed, full_baths, half_baths, sq_ft, prices) -> Final_Complete

write.csv(Final_Complete, "Final_Complete_NEW.csv", row.names = FALSE)

#______________________________________________________________________________________

unique(Final_Complete[, "zip"]) %>% write.csv(file = "uniqe_zip.txt", row.names = FALSE)

read.csv("Zip_Coords.txt", sep = ",") -> zip_coords

#______________________________________________________________________________________

Final_Complete$long = NA
Final_Complete$lat = NA

zip_coords$name %>%
  str_replace_all(pattern = ", United States", replacement = "") -> zip_coords$name

#______________________________________________________________________________________

for(i in 1:nrow(Final_Complete)){

  for(j in 1:nrow(zip_coords)){

    if(as.character(zip_coords$name[j] == as.character(Final_Complete$zip[i]))){

      Final_Complete$long[i] = zip_coords$longitude[j]
      Final_Complete$lat[i] = zip_coords$latitude[j]
      break

      }

  }

}

write.csv(Final_Complete, "Final_Complete_NEW.csv", row.names = FALSE)
First, I split the title post into three separate columns: the location, the street address, and the zip code. For the prices, I removed the dollar sign and the comma separating the thousands and converted it to an integer. For the bed column, I removed the string character and only left the numbers. Finally, I split the bath column into two columns: one for the number of full baths, and the second for the number of half baths.
I also would have liked coordinate data to have been available for each property, but I couldn’t find it in the site’s html source code. I did notice, however, that I have the zip codes for each post. So after a bit of googling, I came across a site called GPS Visualizer which basically converts any address in to longitude/latitude coordinate data. What’s more, it allows you to do this for a group of zip codes, provided that you supply your API key for whatever source that you choose.
After having exported the unique zip codes in my cleaned dataframe, I then pasted the information in to the site and got my coordinate data. I then loaded this coordinate data into R as a CSV file, and then combined it with my cleaned df. I then added another column in the data frame named long and lat, for longitude and latitude; respectively.
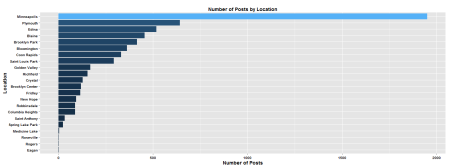
Although I only intended to scrape data that is limited to Minneapolis, I did get some other locations during the extraction. I’m not sure why, or perhaps they are indeed all situated in Minneapolis and this is just evidence of my ignorance of US cities. In any case, I’d be interested to see how many of the posts are not labeled as being situated in Minneapolis.
df -> df_plot

select(df_plot, location) %>%
  group_by(location) %>% summarise(Count = length(location)) -> df_plot

ggplot(df_plot, aes(x = reorder(location, Count), y = Count)) +
  geom_bar(stat = "identity", aes(fill=Count)) +

  labs(x = "Location", y = "Number of Posts",
       title = "Number of Posts by Location") +

  theme(axis.title.x = element_text(face="bold", size=14),
        axis.title.y = element_text(face="bold", size=14),
        axis.text.x = element_text(face="bold", colour="black"),
        axis.text.y = element_text(face="bold", colour="black"),
        plot.title = element_text(face="bold", colour="black")) +

  coord_flip()

#______________________________________________________________________

df -> df_plot

select(df_plot, zip) %>%
  group_by(zip) %>% summarise(Count = length(zip)) -> df_plot

ggplot(df_plot, aes(x = reorder(zip, Count), y = Count)) +
  geom_bar(stat = "identity", aes(fill=Count)) +

  labs(x = "Zip Code", y = "Number of Posts",
       title = "Number of Posts by Zip") +

  theme(axis.title.x = element_text(face="bold", size=14),
        axis.title.y = element_text(face="bold", size=14),
        axis.text.x = element_text(face="bold", colour="black"),
        axis.text.y = element_text(face="bold", colour="black"),
        plot.title = element_text(face="bold", colour="black"),
        legend.position = "none") +

  coord_flip()
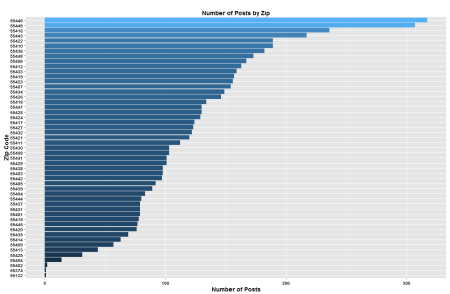
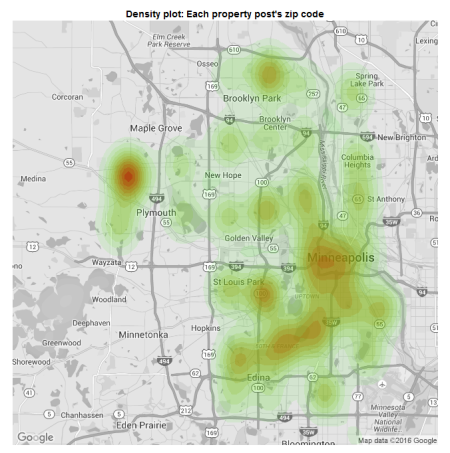
That zip code graph looks a little noisy. Perhaps if I plotted that one on a map would be a little a better.
library(ggmap)
library(ggplot2)

MN = c(min(Final_Complete$long), min(Final_Complete$lat), max(Final_Complete$long), max(Final_Complete$lat))

get_map(location = MN, source = "google", maptype = "roadmap", crop = FALSE, color = "bw") -> MN_map

ggmap(MN_map) +
  stat_density2d(data=df, aes(x = long, y = lat,
                                          fill = ..level..,
                                          alpha = ..level..), geom = "polygon") +

  scale_fill_gradient(low = "#3BE819", high = "#B5170B") +

  theme(axis.text=element_blank(), panel.grid=element_blank(), axis.title=element_blank(),
        axis.ticks.x=element_blank(), axis.ticks.y=element_blank(), legend.position="none",
        panel.background=element_blank(), plot.title = element_text(face="bold", colour="black")) +

  labs(title = "Density plot by zip code") +

  scale_alpha_continuous(range=c(0.1,0.4))
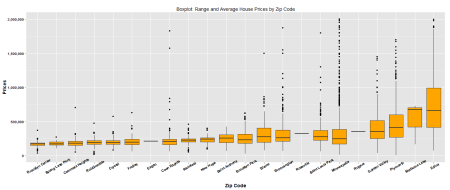
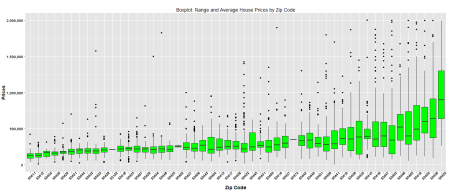
I think it’ll also be very interesting to know what’s the average price of a property for each location and zip code.
df -> df_plot

filter(df_plot, prices <= 2000000) -> df_plot

ggplot(df_plot, aes(x = reorder(location,prices),
                    y = prices)) + geom_boxplot(fill = "orange") +

  labs(x = "Zip Code", y = "Prices",
       title = "Boxplot: Range and Average House Prices by Location") +

  theme(axis.title.x = element_text(face="bold", size=14),
        axis.title.y = element_text(face="bold", size=14),
        axis.text.x = element_text(face="bold", colour="black", angle = 30),
        axis.text.y = element_text(face="bold", colour="black")) +

  scale_y_continuous(labels = comma)

#__________________________________________________________________

df -> df_plot

filter(df_plot, prices <= 2000000) -> df_plot

ggplot(df_plot, aes(x = reorder(zip,prices),
                    y = as.numeric(prices))) + geom_boxplot(fill = "green") +

  labs(x = "Zip Code", y = "Prices",
       title = "Boxplot: Range and Average House Prices by Zip Code") +

  theme(axis.title.x = element_text(face="bold", size=14),
        axis.title.y = element_text(face="bold", size=14),
        axis.text.x = element_text(face="bold", colour="black", angle = 45),
        axis.text.y = element_text(face="bold", colour="black")) +

 scale_y_continuous(labels = comma)
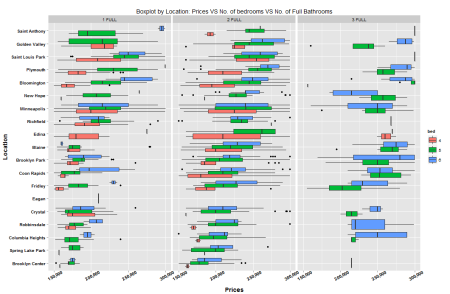
Finally, it’ll be interesting to see how the plots would look like using multiple dimensions.
df -> df_plot

df_plot$bed = as.integer(df_plot$bed)

filter(df_plot, prices >= 150000, prices <= 300000,          bed >= 4, bed <= 6, full_baths != "4 FULL",          full_baths != "5 FULL") -> df_plot

df_plot$bed = as.factor(df_plot$bed)

ggplot(df_plot, aes(x = reorder(location,prices),
                    y = prices)) + geom_boxplot(aes(fill = bed)) +

  labs(x = "Location", y = "Prices",
       title = "Boxplot by Location: Prices VS No. of bedrooms VS No. of Full Bathrooms") +

  theme(axis.title.x = element_text(face="bold", size=14),
        axis.title.y = element_text(face="bold", size=14),
        axis.text.x = element_text(face="bold", colour="black", angle = 30),
        axis.text.y = element_text(face="bold", colour="black")) +

  scale_y_continuous(labels = comma) + facet_grid(~full_baths) + coord_flip()
There are plenty of things with which I could do with this data, especially if you consider the machine learning possibilities. If one could get a hold of the coordinate data of all the schools in each zip code, and perhaps the crime rates in each location…you could come up with a reasonable model that can determine the price of a property using a given set of variables.
But then again, machine learning has never been something I excelled at. I’ve always been interested on how to accurately scrape and clean the data from a given site. Perhaps one day I’ll come up with my very own model instead of just asking others to try and do it. Till then…i’ll leave it to you guys.
Tagged: browser, data, headless, headless browser, programming, r, RSelenium, rstats, rvest, scraping, tidy data, web scraping

R-bloggers.com offers daily e-mail updates about R news and tutorials about learning R and many other topics. Click here if you're looking to post or find an R/data-science job.
Want to share your content on R-bloggers? click here if you have a blog, or here if you don't.