
Quick and easy t-SNE analysis in R
Want to share your content on R-bloggers? click here if you have a blog, or here if you don't.
t-SNE is a useful dimensionality reduction method that allows you to visualise data embedded in a lower number of dimensions, e.g. 2, in order to see patterns and trends in the data. It can deal with more complex patterns of Gaussian clusters in multidimensional space compared to PCA. Although is not suited to finding outliers because how the samples are arranged does not directly represent distance, like in PCA.
An easy way to run t-SNE on your data is to use a pre-made wrapper function that uses the Rtsne package and ggplot2. Like the one that comes with the M3C package (https://bioconductor.org/packages/devel/bioc/html/M3C.html). You can also just take this code from the github and remake it for your own specific needs if necessary (https://github.com/crj32/M3C), it is quite straightforward. The package also has the equivalent functions for PCA and UMAP.
Let’s load some single cell RNA-seq data and demonstrate this function.
This is the Pollen et al. single cell RNA-seq data, but you can use a different kind of omic data, or non omic data. Let’s just take a look at that data.
# load your omic data here as mydata
library(M3C)
data(pollen)
tsne(pollen$data,colvec=c('gold'))
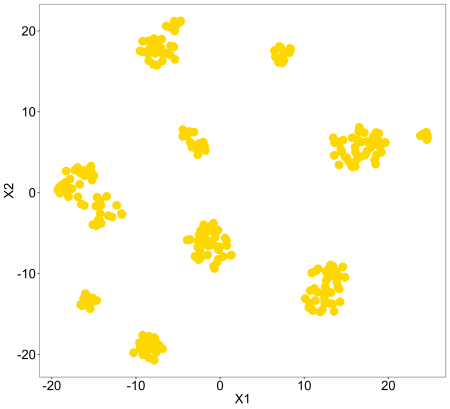
So, we can see this data is neatly grouped into clusters for us. Let’s compare these with the cell type labels. This is just using the default colours, for changing to custom colours we can use the ‘controlscale, ‘scale’, and ‘colvec’ parameters. You can read about these in the documentation using ?tsne.
library(M3C)
tsne(pollen$data,labels=as.factor(pollen$celltypes))

So now we might want to display the expression of a specific gene onto the t-SNE plot, we can easily do this using this function. So the code below can be modified for any given gene, this is for gene ‘HBG1’, we can change this as needed. It just pulls a numerical vector out of the gene expression matrix for us, and z-score scales it for display.
I choose HBG1 because I had run the ‘featurefilter’ function from M3C that collects statistics about all genes in the data frame, such as the coefficient of variation and its second order derivative. Use ?featurefilter to see more information. This gene was the most variable one in the data. Basically this function is for filtering the data according to variance and producing summary statistics per gene.
Here we choose to control the colour scale and setting this to 2 means low is grey and high is red on the scale. However, ‘low’ and ‘high’ may be user specified.
tsne(pollen$data,
labels=scale(as.numeric(pollen$data[row.names(pollen$data)=='HBG1',])),
controlscale = TRUE,scale=2)

Lastly, I want to find out which cell type that HBG1 expression is coming from, we can do this using the PCA function because the dots are too close together to see the text using t-SNE. To do this we have to add a text variable to the pca function.
pca(pollen$data,labels=scale(as.numeric(pollen$data[row.names(pollen$data)=='HBG1',])),
controlscale=TRUE,scale=2,text=pollen$celltypes,
textlabelsize = 2)

So, basically we can zoom in on the printed image and see the red cluster is all the K562 cell type. The text parameter is primarily for finding outliers from PCA, but it can be used in other ways too.
M3C is not for clustering single cell RNA-seq data because of the high complexity of the algorithm and the type of consensus clustering it does, but we can use its functions for other purposes anyway. It is good for clustering cancer single-omic data though, for example. It is essentially an enhanced version of the Monti consensus clustering algorithm, implemented originally in the consensusclusterplus package.
For an algorithm that can handle single cell RNA-seq better and also a wide range of omic and non omic data, Spectrum is a good option (https://cran.r-project.org/web/packages/Spectrum/index.html). It is faster and more sophisticated in many ways to the consensus clustering approach. Also good for single cell RNA-seq clustering are SC3 and Seurat.
R-bloggers.com offers daily e-mail updates about R news and tutorials about learning R and many other topics. Click here if you're looking to post or find an R/data-science job.
Want to share your content on R-bloggers? click here if you have a blog, or here if you don't.