
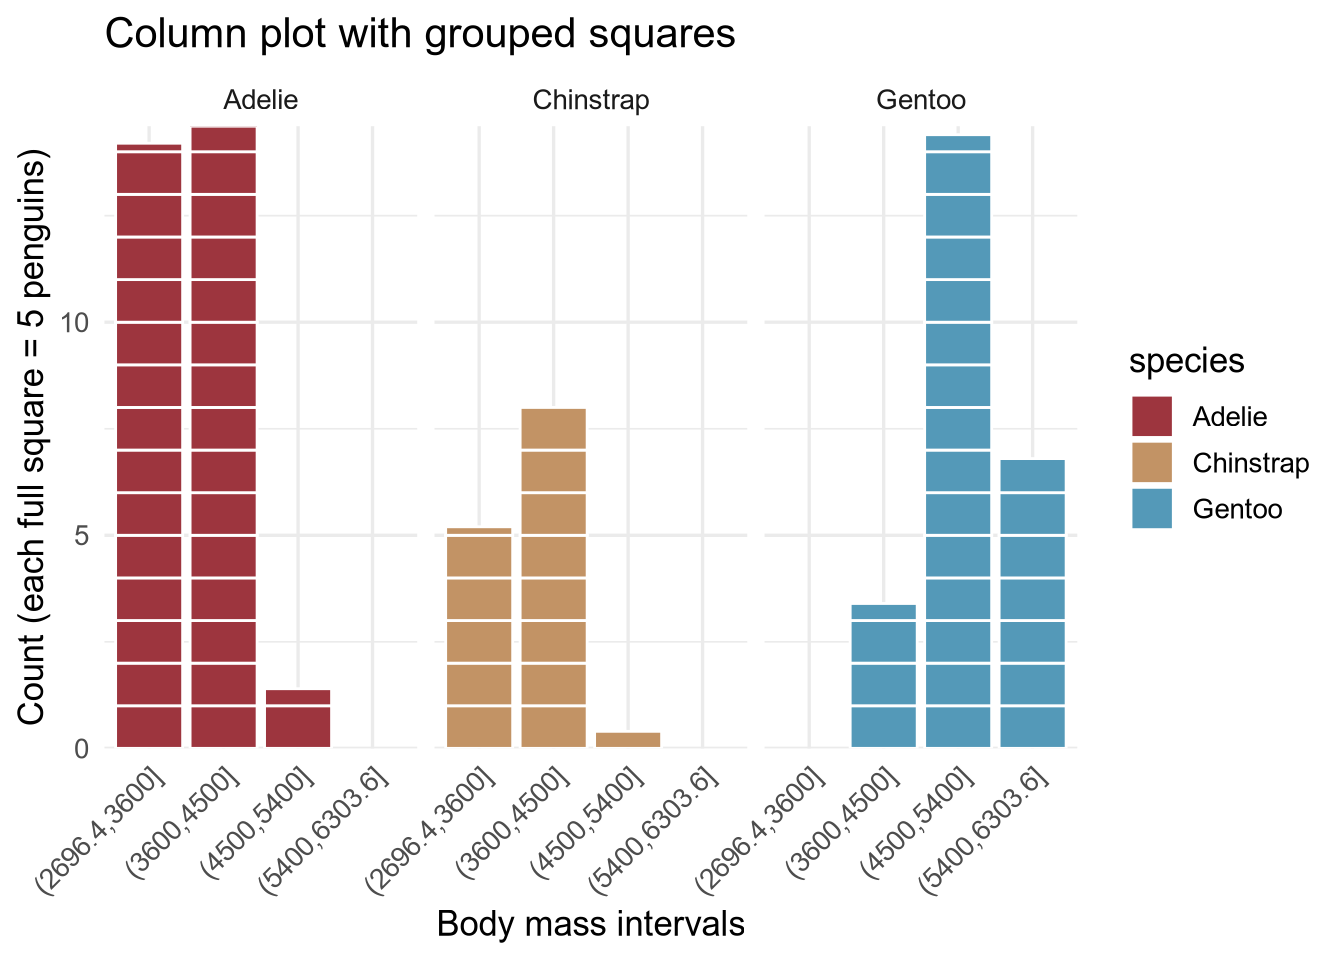
How do you make a histogram with equally sized dots or squares for each observation, and colour them by another
How to learn C++ as an R user?
Because of delays with my scholarship payment, if this post is useful to you I kindly ask a minimal donation on Buy Me a Coffee that shall be used to continue my Open Source efforts. If you need an R package or Shiny dashboard for your team, you ... [Read more...]
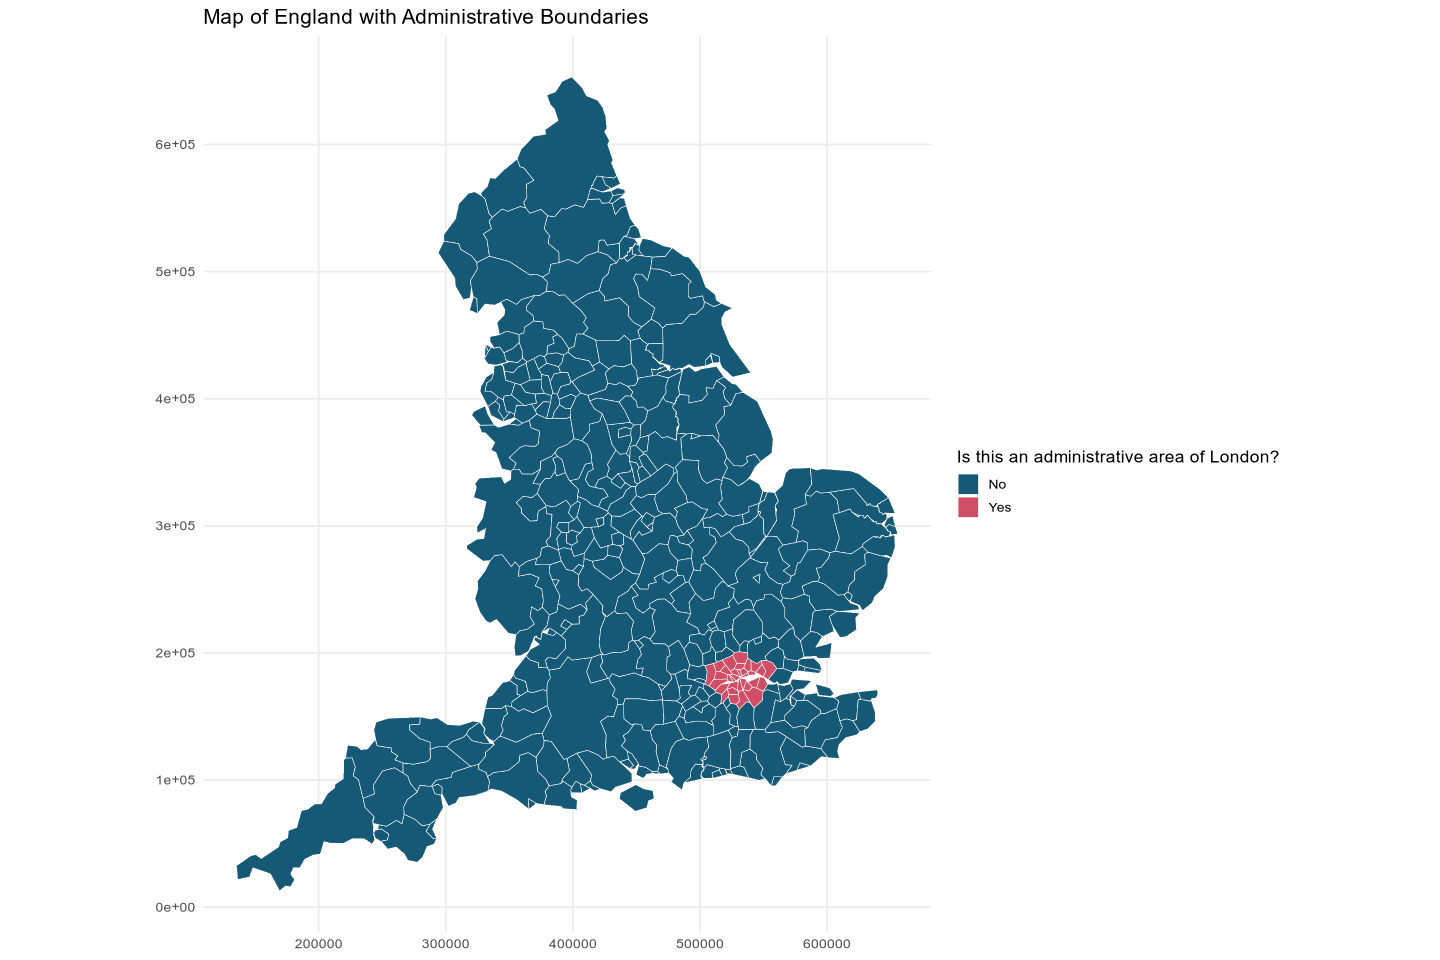
Plotting UK Maps with ggplot2 (Part 2)
Because of delays with my scholarship payment, if this post is useful to you I kindly ask a minimal donation on Buy Me a Coffee that shall be used to continue my Open Source efforts. If you need an R package or Shiny dashboard for your team, you ...

rOpenSci News Digest, August 2025
Dear rOpenSci friends, it’s time for our monthly news roundup! You can read this post on our blog. Now let’s dive into the activity at and around rOpenSci!
rOpenSci HQ
Community call: “R-multiverse: a new way to publish R package... [Read more...]
Plotting UK Maps with ggplot2 (Part 2)
How to learn C++ as an R user
Answering reader's questions. [Read more...]
Plotting UK Maps with ggplot2
Because of delays with my scholarship payment, if this post is useful to you I kindly ask a minimal donation on Buy Me a Coffee. It shall be used to continue my Open Source efforts. The full explanation is here: A Personal Message from an Open So...
Capybara v1.8.0 is now available on CRAN
Because of delays with my scholarship payment, if this post is useful to you I kindly ask a minimal donation on Buy Me a Coffee. It shall be used to continue my Open Source efforts. The full explanation is here: A Personal Message from an Open S...
July 2025 Top 40 New CRAN Packages
Causal Inference
ciflyr v0.1.1: Provides a framework for specifying flexible linear-time reachability-based algorithms for graphical causal inference. Rule tables are used to encode and customize the ‘reachability’ algorithm for typical causa...
Plotting UK Maps with ggplot2
Capybara v1.8.0 is now available on CRAN
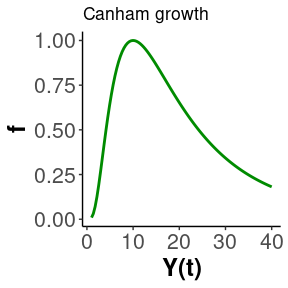
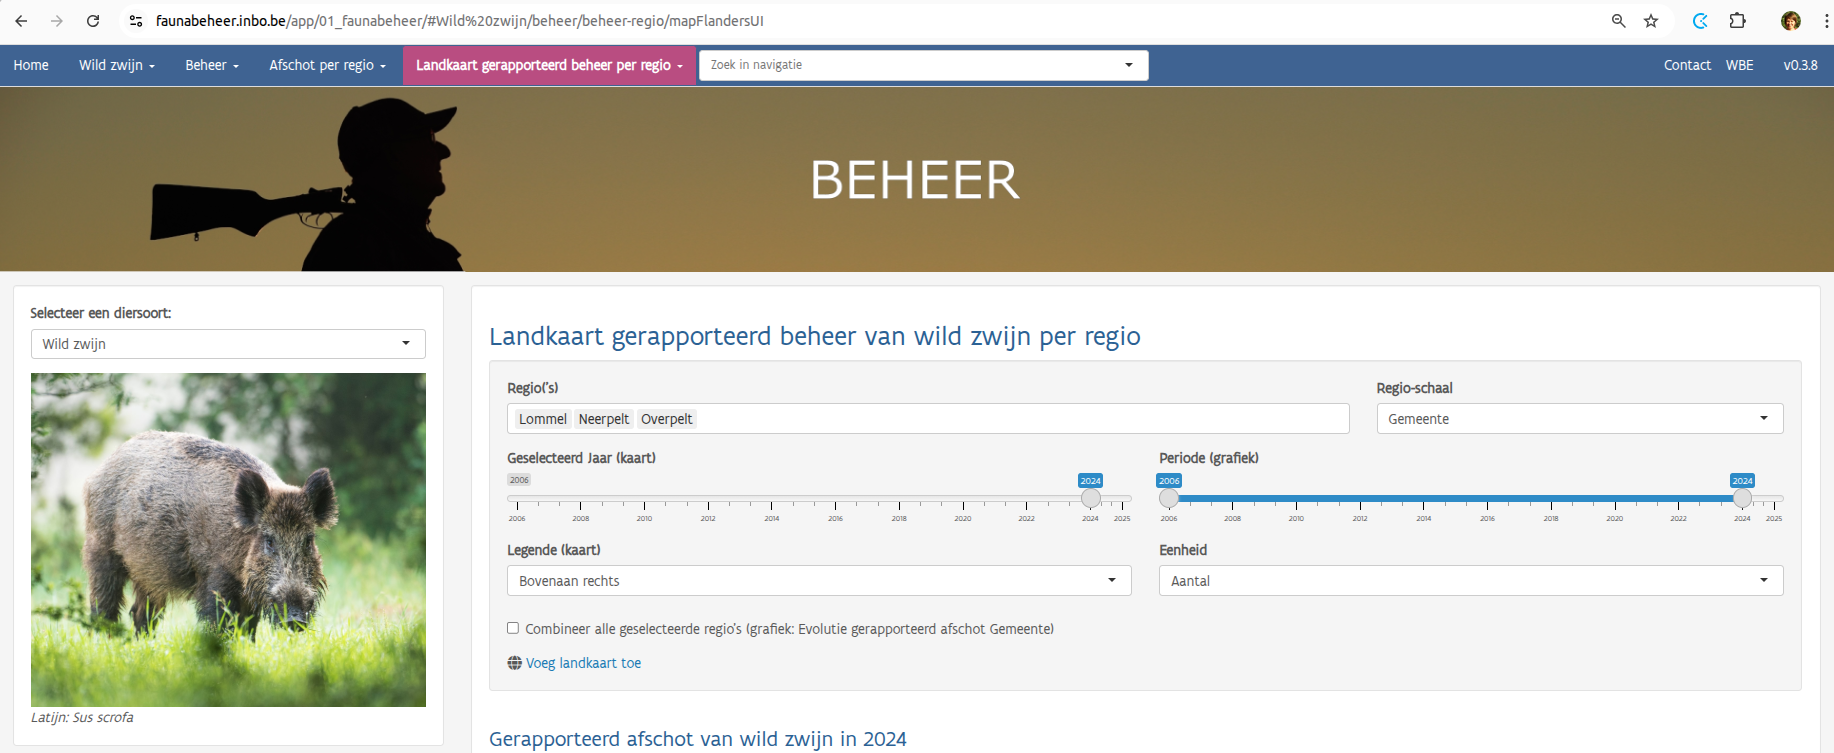
Wildlife management
Introduction
Open Analytics often receives requests to visualize and summarize data from multiple data
sources in a user-friendly way. Most of these projects result in in-house applications, while
projects for governmental institutions typically resul...
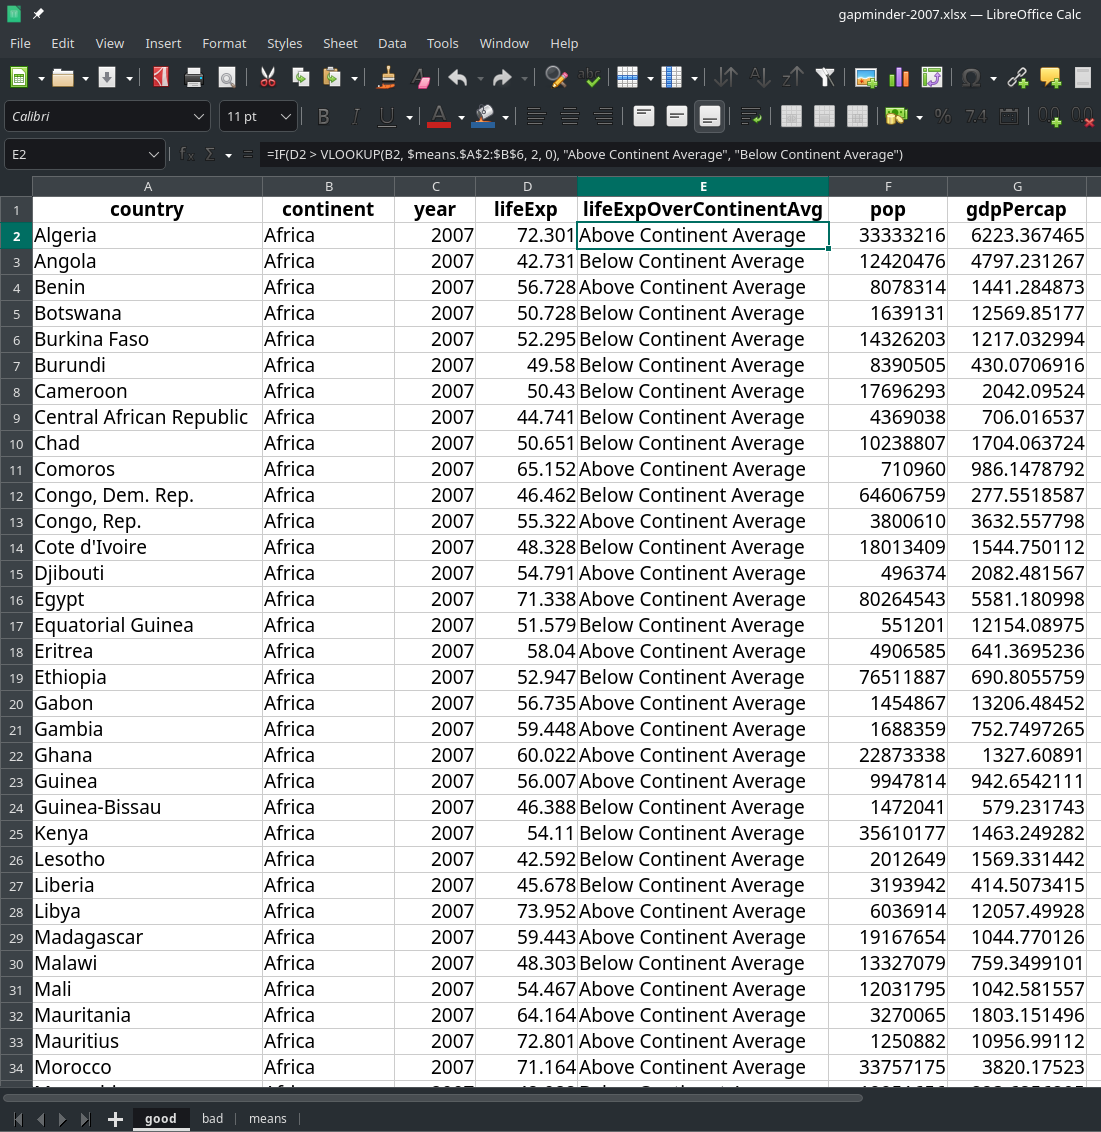
Reading conditional formatting in XLSX files in a Tidy way with readxl
Because of delays with my scholarship payment, if this post is useful to you I kindly ask a minimal donation on Buy Me a Coffee or GitHub Sponsorships. It shall be used to continue my Open Source efforts. The full explanation is here: A Personal ...
Send Me Your Questions and Ideas
I’m always looking for ways to make this blog more useful for the R, Shiny, and C++ community.
If you have a topic you’d like to see covered—whether it’s how to read Stata files in R, tidying up a public dataset, or anything else—I’d ... [Read more...]
A Personal Message from an Open Source Contributor
Dear fellow developers and data scientists,
If everyone reading this gave just the price of a coffee, I could focus fully on the open source work that serves our community. But not everyone can or will contribute, and that’s okay.
It’s been two w... [Read more...]
Exploring Open Science, R Packages, and Research Software Development at the CSIDNet AGM 2025
The “Climate Sensitive Infectious Disease” (CSID) Network looks to connect a global community of actors contributing towards impactful CSID software tools and establish localized CSID communities that can link existing on-the-ground issues and initiat... [Read more...]
Reading conditional formatting in XLSX files in a Tidy way with readxl
Data organization issues derived from not using the tools correctly and its solution.
A Personal Message from an Open Source Contributor
Dear fellow developers and data scientists... [Read more...]
Send Me Your Questions and Ideas
I'm always looking for ways to make this blog more useful for the R, Shiny, and C++ community. [Read more...]
Copyright © 2026 | MH Corporate basic by MH Themes