As a data science consultancy, Jumping Rivers are already known for offering help and training to clients in all things data. But did you know that we also organise free, in-person data science meetups?
In this post we will talk through the typic...
10:10:10 on 10/10/10 - “Give Me A Little More Time” – CC-BY-NC-SA by Jill Clardy
Day 13 of 30DayMapChallenge: « 10 minute map » (previously).
Where can you go in 10 minutes (by car) from Les Minutes?
library(osrm)
library(leaflet)
library(glue)
Data
We use {osrm} to build the isochrone. The service is based on OpenStreetMap data.
...
R workshops in Brisbane Australia, February 2026.
For many years I had the pleasure of teaching with Ant Richardson and the team for these R workshops. I’m not there anymore, but recommend attending these if you can make the dates:
Transform yo...
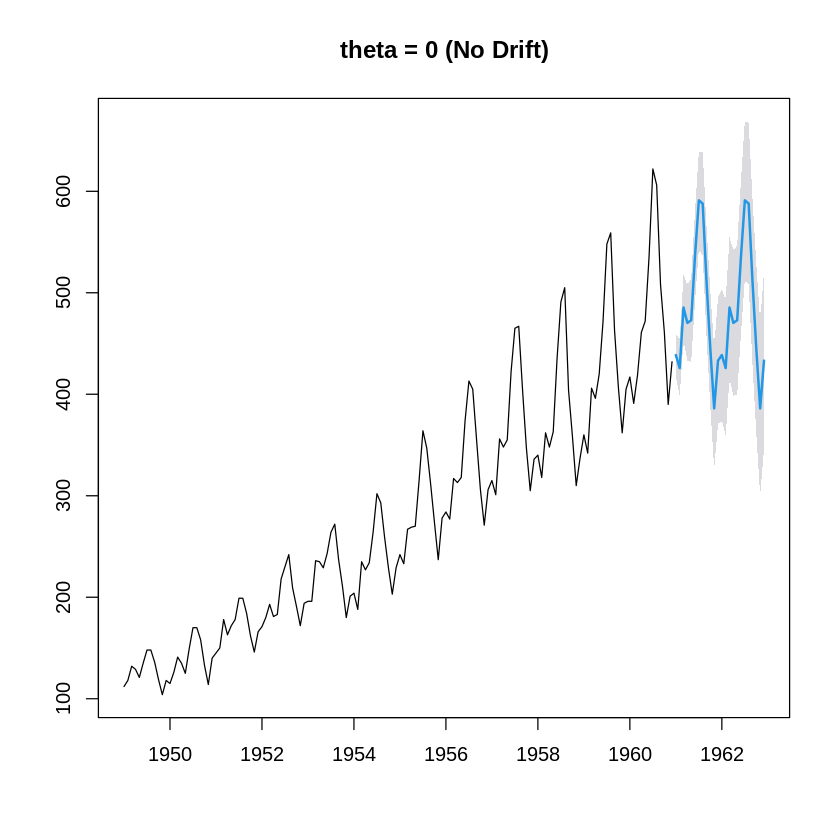
Explore the context-aware Theta method, a flexible extension of the classical Theta forecasting approach that incorporates tunable drift parameters and machine learning-based slope estimation.
Vignemale – CC-BY-NC-SA by Jon Larrañaga
Day 12 of 30DayMapChallenge: « 2125 » (previously).
Vidaller et al. (2021) indicate that Pyrenean glaciers are in a clear imbalance with the regional climate and will likely disappear...
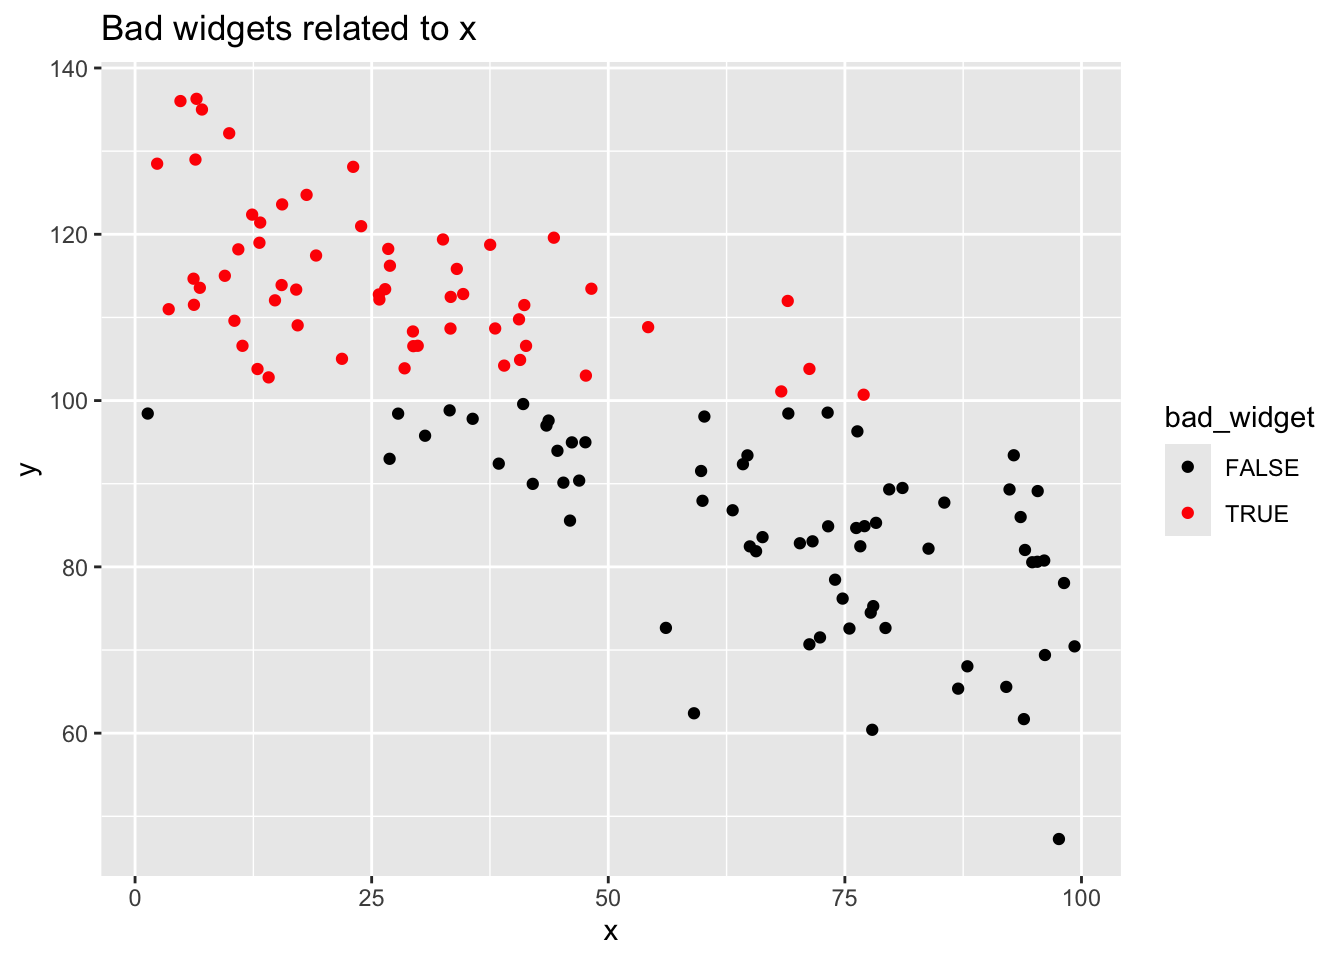
In which we generate a dataset of game durations, do a little exploratory data analysis and then try to identify unusual instances and their causes. In my Twitter-whinge-post, I mentioned that one of its last redeeming features is the AFL statistics community. I always feel the need to apologise for ...
Editor’s Note: This post first appeared on the Revolution Analytics/Microsoft Blog, “Revolutions” on August 2, 2016. As the Revolutions blog no longer exists, we are republishing it here with permission from the author.
ROC curves are commonly u...
In a previous article, I shared my experience as an R developer diving into Python package development!
I had noted several aspects that felt less smooth than in R, or even completely missing!
Thanks to feedback from the community, I’ve been abl... [Read more...]
Cardo Maximus, Jerash, Jordan – Public domain by Mustang Joe
Day 11 of 30DayMapChallenge: « Minimal » (previously).
A recent dataset of Roman Empire’s road system has just been published (de Soto et al. 2025) and is updated ...
They say that number Pi holds all infinite possibilities, all the words, all the combinations. Well, easier said to be done. So let’s put this to a test. This is my translational table. We will do this in the following…Read more ›
This past September I gave the closing keynote at posit::conf; it’s now on YouTube to watch. Keen-eyed observers will note from the title that it’s about trustworthy data visualization. But it’s also about trust a bit mo... [Read more...]
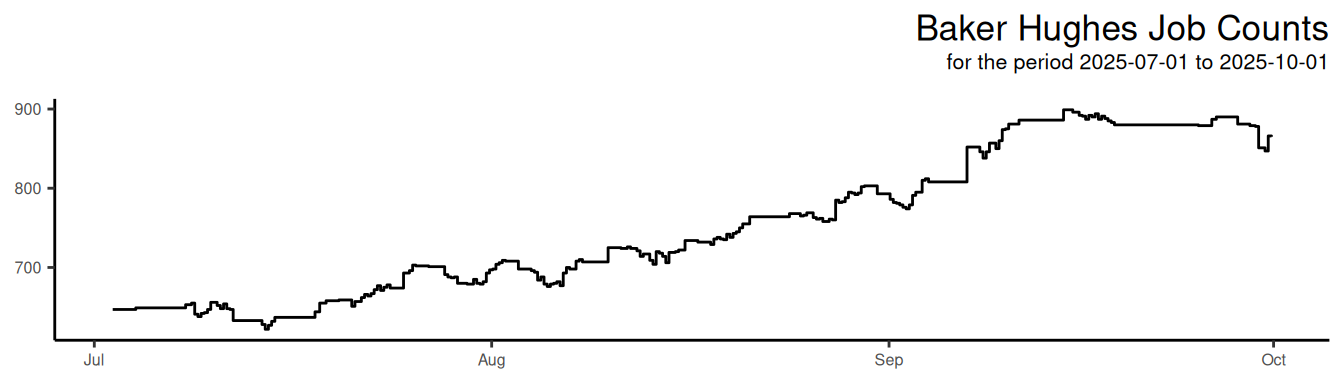
I’ve recently been given early access to a service that provides data on job listings published by a wide range of companies. The dataset offers a near real-time view of hiring activity, broken down at the company level. This is a potentially valuable signal for tracking labour market trends, ...
There’s a lot of hype about AI agents, but buried under the hype there is a really simple architecture. I got inspired by this post that points out how easy it is to make an AI agent.
In this post I’ll show how to make an agent in ... [Read more...]
Motivation
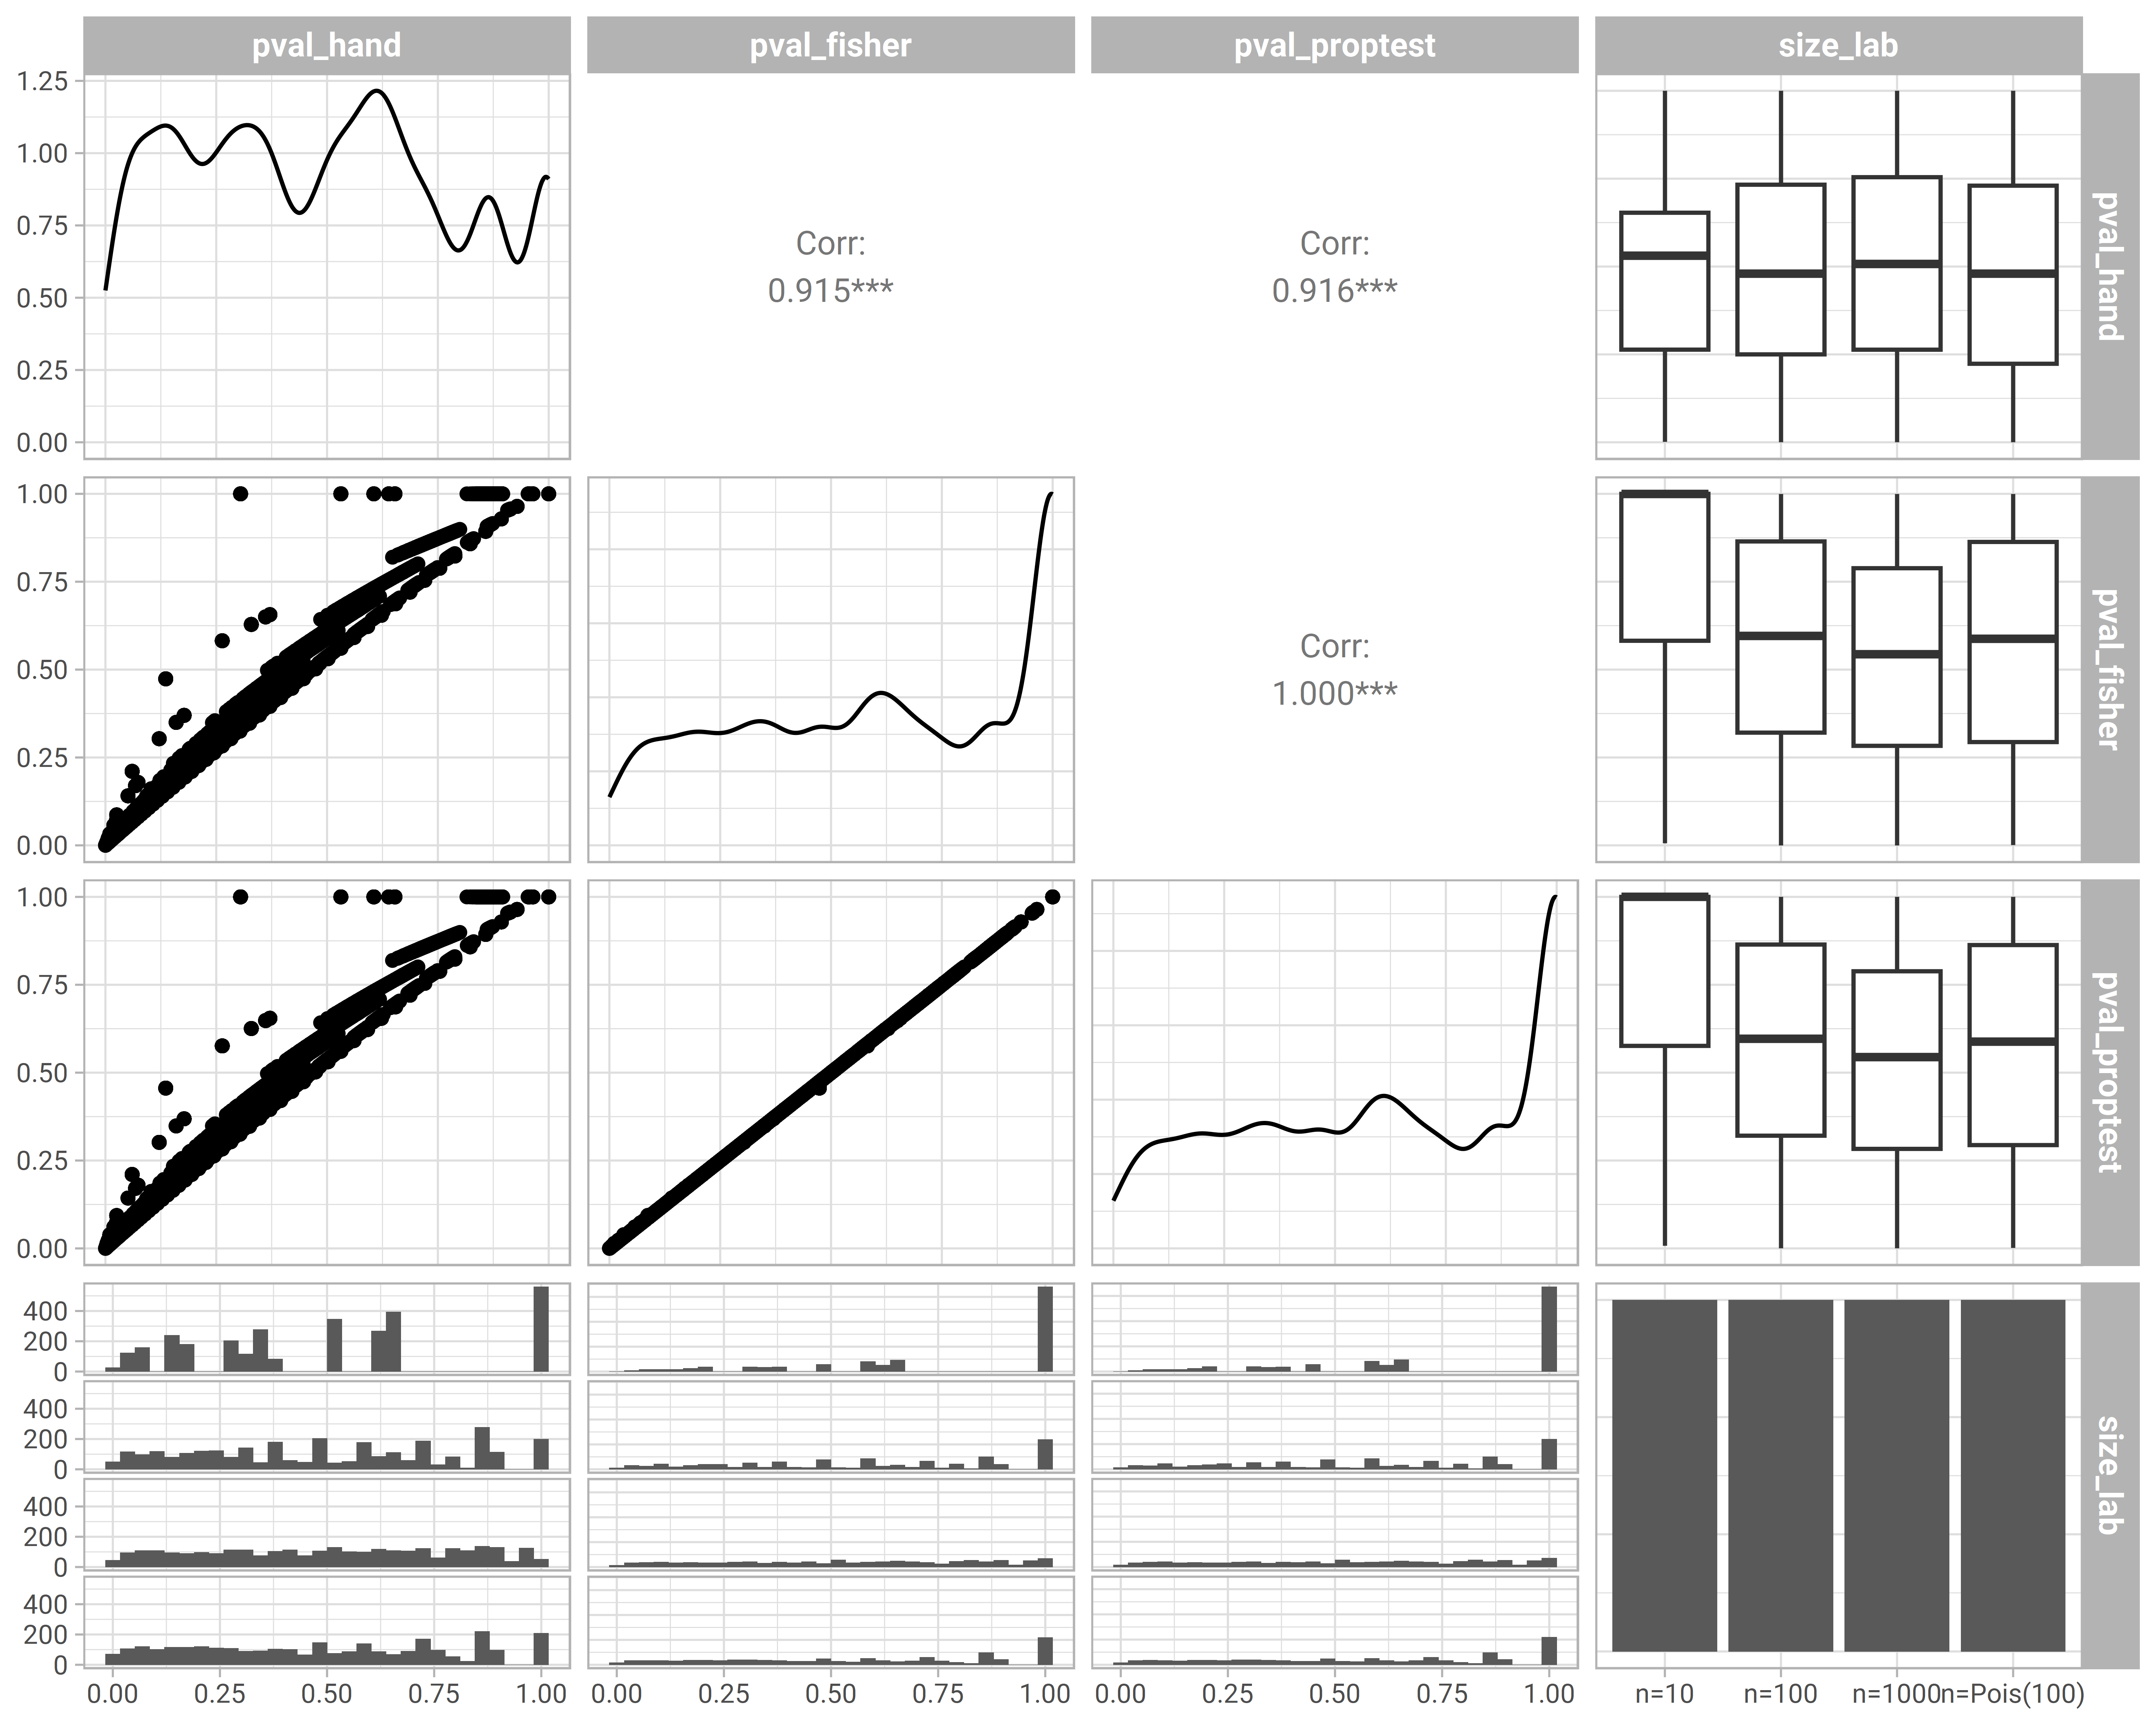
A few months back in a side skirmish during the great p-curve controversy, Richard McElreath mentioned that p-values under the null hypothesis are not always uniformly distributed, as is sometimes claimed. This prompted me to check out the ...
Storms Over the Ocean – CC-BY-NC by Lochaven
Day 10 of 30DayMapChallenge: « Air » (previously).
Where did it rain the most in a day last year?
Using ERA5 post-processed daily statistics on single levels from 1940 to present....
Sunset over Rouen, Normandy, France – Public domain by Pierre Blaché
Day 8 of 30DayMapChallenge: « Urban » (previously).
French Urban unit database from INSEE.
The concept of an urban unit is based on continuous built-up ar...
IMG_9811 – CC-BY-NC by Eddie Lawrance
Day 7 of 30DayMapChallenge: « Accessibility » (previously).
Well, let us be rebellious and instead seek inaccessibility; more precisely the pole of inaccessibility of France (the Hexagon...
365 Data Science opens its doors this November 100% for free! From November 6 to November 21, 2025 (8 a.m. UTC), enjoy unlimited access to the entire platform, including a wide range of R programming courses and projects. This offer features expert-led courses, practical projects, and interactive exercises covering diverse topics in AI and data … ... [Read more...]
Mamdani’s victory in the New York City mayoral election gave me the opportunity to draw a few maps, and also to learn a bit about incorporating additional spatial data into maps drawn in R. R is not a specialized piece of GIS software. ESRI&rsquo... [Read more...]