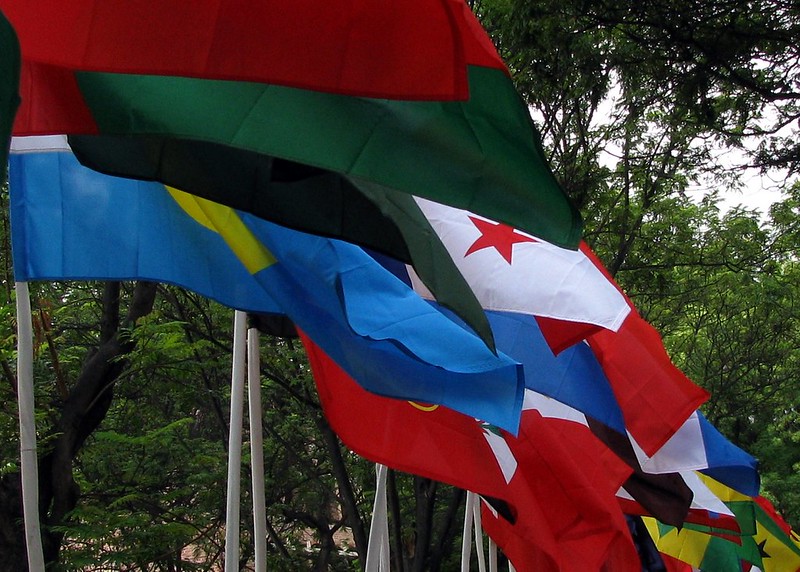
Moving back home

April 8, 2025 | HighlandR

Apologies for this very poor blog post, but this is the easiest way to inform most readers at the same time. In case you did not notice, my website has changed back from my name dot net, to my name dot com. Just change the domain over and... [Read more...]

Shiny in Production 2024 Videos

April 8, 2025 | The Jumping Rivers Blog

2024 Videos Considering a ticket for Shiny in Production 2025 but unsure what to expect? Maybe you attended in past years but missed out in 2024, or you simply want a refresher on last year’s highlights. Whatever the case, the video player below has you covered! Explore six in-depth talks, four lightning ...
[Read more...]

A Quick Guide to Getting the Most Out of ShinyConf 2025

April 8, 2025 | Gift Kenneth

ShinyConf 2025 is almost here! From April 9 to 11, thousands of data scientists, developers, and Shiny fans will come together online to share ideas, build skills, and connect. Whether you’re joining for the workshops, the talks, the networking, or all of it, this post will walk you through how to get ...
[Read more...]

Code collaboration in NEST

April 7, 2025 | Ilse Augustyns

In the ever-evolving field of clinical data analysis, innovation and collaboration are key. Today, we are pleased to share an initial, yet important milestone as part of a collaboration effort between Roche and Clinical & Statistical Progr... [Read more...]

Musical Journey Through Numbers

April 6, 2025 | Asitav Sen

A Data-Driven Analysis of My Music Listening Habits My listening data from Apple Music reveals extensive engagement: over 450 songs from approximately 240 albums were played more than 6,700 times, totaling over 240 hours of music. This averages to roughly 1.6 hours of daily listening, with each song played about 44 times. This analysis, inspired by ...
[Read more...]

Electoral bonds data in charts

April 5, 2025 | Asitav Sen

Bonds worth ₹ 121 Billion purchase between Apr 2019 and Jan 2024 Data was downloaded from dataful. Rows without reference number or with status Expired are not considered in this analysis. Hence, there may be a variation between the numbers.of excluded data is available below Code highchart() |__ hc_chart(type = "sankey", inverted = FALSE) |__ ... [Read more...]

Three Tips for Better R Figures

April 5, 2025 | Boyd Tarlinton

Recently I shared my favourite ways to ensure your R plots look great in Quarto documents. Now I want to share my most commonly used tips for building effective and readable plots in R. As an example dataset I’ll be using chip_dataset.csv, downlo...
[Read more...]

Resume

April 3, 2025 | Stencilled

SENTHIL THYAGARAJAN (504) 908 0008 | [email protected] Portfolio: http://www.stencilled.me https://www.linkedin.com/in/senthilthyagarajan/ PROFESSIONAL EXPERIENCE Analytics Director, Mekanism, New York, NY June 2023 –Present Built real-time... [Read more...]

Resume

April 3, 2025 | Stencilled

SENTHIL THYAGARAJAN (504) 908 0008 | [email protected] Portfolio: http://www.stencilled.me https://www.linkedin.com/in/senthilthyagarajan/ PROFESSIONAL EXPERIENCE Analytics Director, Mekanism, New York, NY June 2023 –Present Built real-time... [Read more...]

Population pyramid plots with base R

April 3, 2025 | HighlandR

You will find the app demonstrating these pyramid plots here A brief timeline of this plot: It started off as a revised ggplot function for an internal charting package, with source data saved as parquet files. Then, because I wanted to tr... [Read more...]
1 12 13 14 15 16 2,187