
pacman Ver 0.4.1 Release
Want to share your content on R-bloggers? click here if you have a blog, or here if you don't.
It was just over a year ago that Dason Kurkiewicz and I released pacman to CRAN. We have been developing the package on GitHub in the past 14 months and are pleased to announce these changes have made their way to CRAN in version 0.4.1.

What Does pacman Do?
pacman is an R package management tool that combines the functionality of base library related functions into intuitively named functions. This package is ideally added to .Rprofile to increase workflow by reducing time recalling obscurely named functions, reducing code and integrating functionality of base functions to simultaneously perform multiple actions.
We really wished people would use pacman to share code (blog posts and help list/boards). The reason is selfish. Often one is trying out code and the poster has ten new packages in use that we don’t have. This means we have to stop the act of trying out the poster’s code to install the packages being used. To add injury to insult multiple library calls makes the script less readable.
Sing it with us…
Imagine there’s no install.packages
It’s easy if you try
No multiple library calls
Above us only sky
Imagine all the coders
Using pacman today…
Skip to the bottom where we demo what this coders utopia looks like.
What’s New in Version 0.4.1?
Here are a few of the most notable highlights.
- Support for Bioconductor packages added compiments of Keith Hughitt.
p_bootadded to generate a string for the standard pacman script header that, when added to scripts, will ensure pacman is installed before attempting to use it. pacman will attempt to copy this string (standard script header) to the clipboard for easy cut and paste.p_install_version_ghandp_load_current_ghadded as partners top_install_versionfor GitHub packages. Thanks to Steve Simpson for this.
Example Use
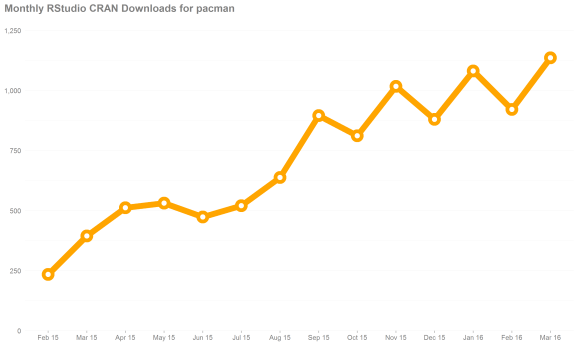
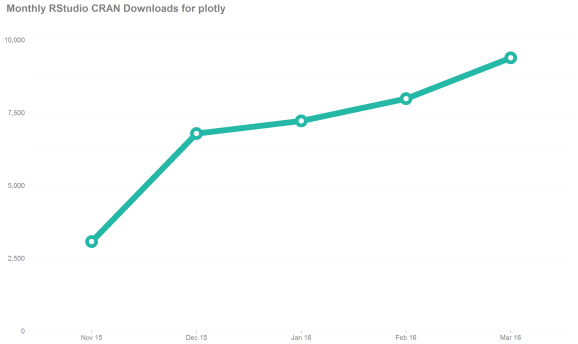
We will examine pacman‘s popularity in the last 14 months. We implore the readers to make the package used even more by using it in scripts posted online.
This script uses pacman to allow the user to check for, install, and load the four required packages all with two easy lines of code. The first line (compliments of p_boot) just makes sure pacman is installed. The later checks for, installs, and loads the packages. It’s pretty nice to just run a script isn’t it?
if (!require("pacman")) install.packages("pacman")
pacman::p_load(cranlogs, dplyr, ggplot2, scales)

package <- "pacman"
color <- "#26B8A6"
hjust <- -.069
start <- "2015-02-01"

lvls <- format(seq(as.Date(start), to = Sys.Date(), by = "month"), format = "%b %y")


dat <- cran_downloads(packages=package, from=start, to = Sys.Date()) %>%
    tbl_df() %>%
    select(-package) %>%
    mutate(
      date = as.POSIXct(date),
      month = factor(format(date, format = "%b %y"), levels = lvls)
    ) %>%
    na.omit() %>%
    rename(timestamp = date)


aggregated <- dat %>%
  group_by(month) %>%
  summarize(n=sum(count), mean=mean(count), sd=sd(count)) %>%
      filter(n > 0)

aggregated  %>%
      ggplot(aes(month, n, group=1)) +
          geom_path(size=4, color=color) +
          geom_point(size=8, color=color) +
          geom_point(size=3, color="white") +
          theme_bw() +
          #ggplot2::annotate("segment", x=-Inf, xend=-Inf, y=-Inf, yend=Inf, color="grey70") +
          labs(
              x = NULL, #"Year-Month",
              y = NULL, #"Downloads",
              title = sprintf("Monthly RStudio CRAN Downloads for %s", package)
          ) +
          theme(
              text=element_text(color="grey50"),
              panel.grid.major.x = element_blank(),
              panel.border = element_blank(),
              axis.line = element_line(),
              axis.ticks.x = element_line(color='grey70'),
              axis.ticks.y = element_blank(),
              plot.title = element_text(hjust = hjust, face="bold", color='grey50')
          ) +
          scale_y_continuous(
              expand = c(0, 0),
              limits = c(0, max(aggregated$n)*1.15),
              labels = comma
          )
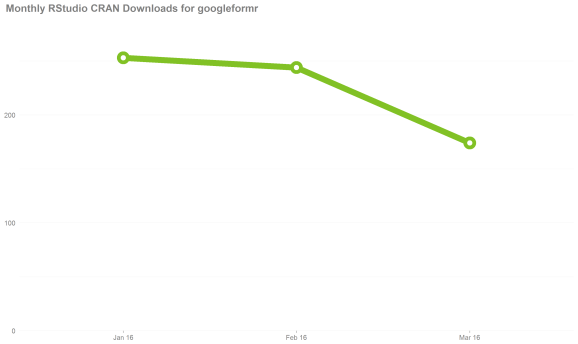
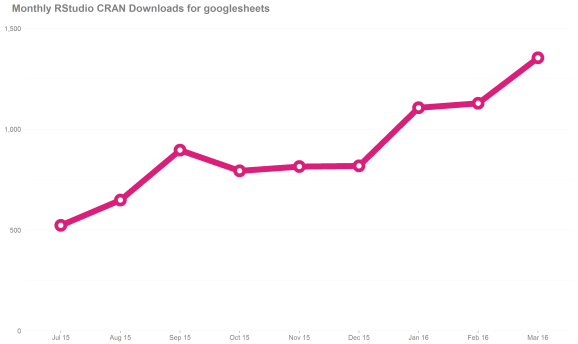
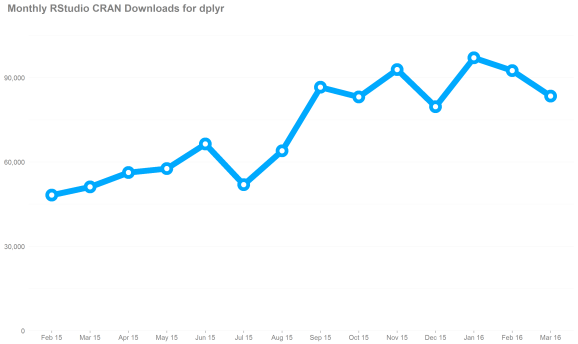
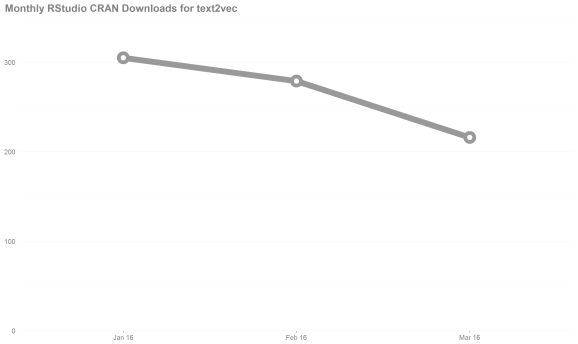
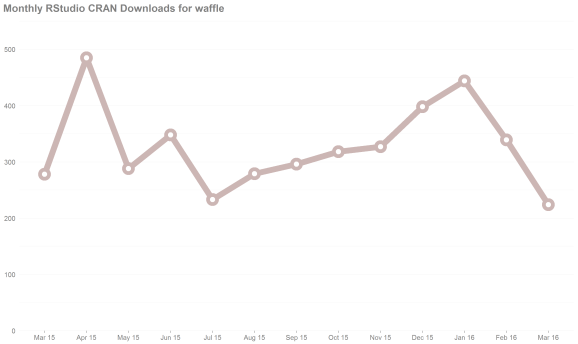
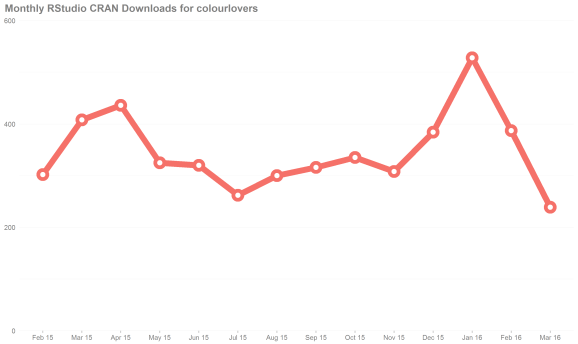
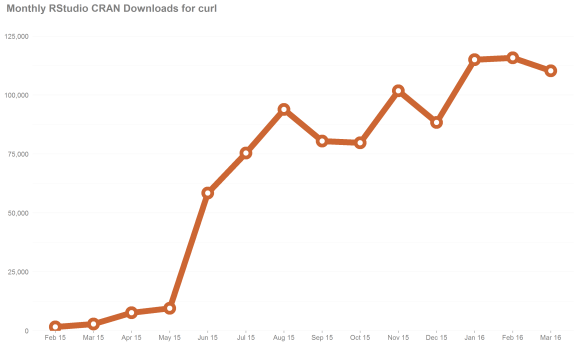
The script is customizable for any package. Here we view a few more packages’ usage (some of the ones I’ve been enjoying as of late). Oh and you can download all of these packages via:
if (!require("pacman")) install.packages("pacman")
pacman::p_load(googleformr, googlesheets, dplyr, text2vec, waffle, colourlovers, curl, plotly)

R-bloggers.com offers daily e-mail updates about R news and tutorials about learning R and many other topics. Click here if you're looking to post or find an R/data-science job.
Want to share your content on R-bloggers? click here if you have a blog, or here if you don't.