
Optimism corrected bootstrapping: a problematic method
Want to share your content on R-bloggers? click here if you have a blog, or here if you don't.
There are lots of ways to assess how predictive a model is while correcting for overfitting. In Caret the main methods I use are leave one out cross validation, for when we have relatively few samples, and k fold cross validation when we have more. There also is another method called ‘optimism corrected bootstrapping’, that attempts to save statistical power, by first getting the overfitted result, then trying to correct this result by bootstrapping the data to estimate the degree of optimism. A few simple tests in Caret can demonstrate this method is bunk.
This is a very straightforward method, just add random variables from a normal distribution to the ground truth iris labels. We should find our AUC (area under ROC curve) is about 0.5. Yet for optimism corrected bootstrap it gives a positive result regardless of whether the predictors are just noise or not. Let’s just run that test:
This is called a sensitivity analysis for the uninitiated, I am just increasing number of random noise features (z) and binding them to the real labels in an iterative manner.
library(caret)
allresults <- matrix(ncol=2,nrow=200)
i = 0
for (z in seq(10,2000,10)){

  i = i + 1

  # select only two species
  iris <- subset(iris, iris$Species == 'versicolor' | iris$Species == 'virginica')
  iris$Species <- droplevels(iris$Species)
  # generate random data
  test <- matrix(rnorm(100*z, mean = 0, sd = 1),
                 nrow = 100, ncol = z, byrow = TRUE)
  # bind random data
  iris <- cbind(iris,test)
  # remove real data
  iris <- iris[,-1:-4]

  # cross validation
  ctrl <- trainControl(method = 'cv',
                       summaryFunction=twoClassSummary,
                       classProbs=T,
                       savePredictions = T,
                       verboseIter = T)
  fit3 <- train(as.formula( paste( 'Species', '~', '.' ) ), data=iris,
                method="glmnet", # preProc=c("center", "scale")
                trControl=ctrl, metric = "ROC") #
  allresults[i,1] <- max(fit3$results$ROC)

  # optimism corrected bootstrapping
  ctrl <- trainControl(method = 'optimism_boot',
                       summaryFunction=twoClassSummary,
                       classProbs=T,
                       savePredictions = T,
                       verboseIter = T)
  fit4 <- train(as.formula( paste( 'Species', '~', '.' ) ), data=iris,
                method="glmnet", # preProc=c("center", "scale")
                trControl=ctrl, metric = "ROC") #
  allresults[i,2] <- max(fit4$results$ROC)

  rm(iris)
}

df <- data.frame(allresults)
colnames(df) <- c('cross_validation','optimism_corrected_boot')
df2 <- reshape2::melt(df)
df2$N <- c(seq(10,2000,10),seq(10,2000,10))

# do the plot
p1 <- ggplot(df2, aes(x=N, y=value, group=variable)) +
  geom_line(aes(colour=variable))
png('bias_in_optimism_corrected_bootstrapping.png', height = 15, width = 27, units = 'cm',
    res = 900, type = 'cairo')
print(p1)
dev.off()
So there we have it, a method that is being used in publications as we speak, but it is horribly bias. This is science for you, full of misinformation and lies. Be warned, there is a darkness out there R readers, not just in Washington.
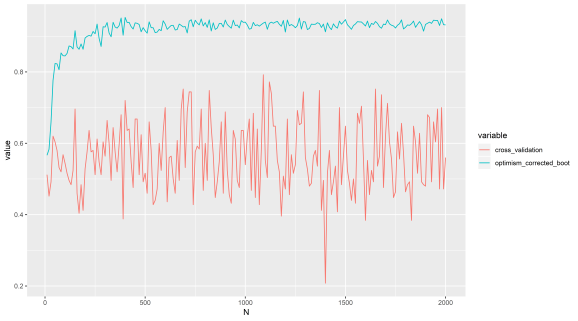
N (x axis) refers to number of features here (that are just noise). AUC (y axis) is about 0.5 when we have no predictive power.
We can see cross validation performs as expected, it is a bit unstable though, better to use repeated cross validation I think.
My recommendations for Rbloggers readers who don’t know much about supervised machine learning, but want to use it on their data in R:
- Don’t start by implementing cross validation loops your self and calculate AUC etc, Caret makes life a lot easier and it is bug tested by thousands of people around the world like myself.
- Stick with tried and tested mainstream approaches when in doubt. Like LOOCV or repeated k fold CV.
- If implementing your own method or skeptical of the reliability of the method your using, use rnorm to perform a negative control to test your statistical method for bias. This is a good check to perform, as well as a positive control.
- Make sure your data is in the correct order.
R-bloggers.com offers daily e-mail updates about R news and tutorials about learning R and many other topics. Click here if you're looking to post or find an R/data-science job.
Want to share your content on R-bloggers? click here if you have a blog, or here if you don't.