
Is it possible to use RevoScaleR package in Power BI?
Want to share your content on R-bloggers? click here if you have a blog, or here if you don't.
I was invited to deliver a session for Belgium User Group on SQL Server and R integration. After the session – which we did online using web based Citrix – I got an interesting question: “Is it possible to use RevoScaleR performance computational functions within Power BI?“. My first answer was, a sceptical yes. But I said, that I haven’t used it in this manner yet and that there might be some limitations.
The idea of having the scalable environment and the parallel computational package with all the predictive analytical functions in Power BI is absolutely great. But something tells me, that it will not be that straight forward.
So let’s start by taking a large (500 MB) txt file and create XDF file:
library(RevoScaleR)
file.name <- "YearPredictionMSD.txt"
rxOptions(sampleDataDir = "C:\\Files")
sampleDataDir
File is available on-line at this address with the zip file.
Getting data with R script
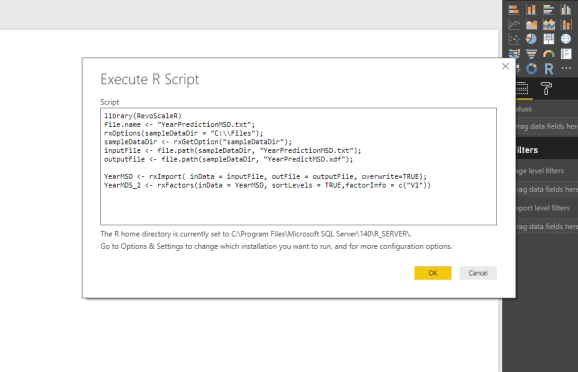
Open Power BI and choose Get Data -> R Script -> and copy/Paste the following slightly changed code:
library(RevoScaleR)
file.name <- "YearPredictionMSD.txt";
rxOptions(sampleDataDir = "C:\\Files");
sampleDataDir
With copy pasting and clicking OK,
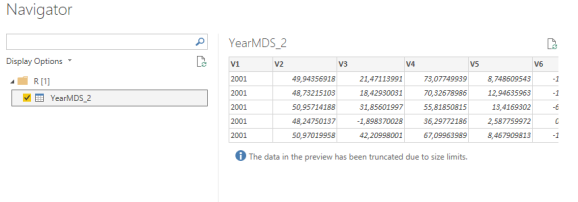
You will have to wait for the data to be read into the memory, the data models to be created and after monitoring the memory consumption and patiently waiting, you will notice, that this particular dataset (500 MB or 160 MB XDF), that minimum 3 GB of RAM will be consumed and you will end up with preview:
By now, you will also notice that after saving this Power BI document, it will take somewhere up to 700 MB of your disk space and all the data visualization will consume additional RAM and time. After you will close the Power BI document, you will notice a lot of RAM being released.
Using R Script in the visuals
When you create a new Power BI document, I will create new dataset by Entering data. I will create three “dummy” variables.
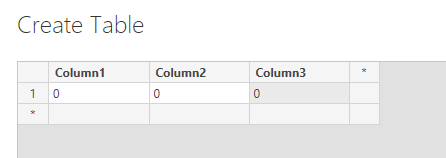
With these three variables I will try to inject the data returned from XDF data format and have data represented in Power BI.
After selecting the new visual and choosing R visual, I inserted following code:
library(RevoScaleR)
file.name <- "YearPredictionMSD.txt";
rxOptions(sampleDataDir = "C:\\Files");
sampleDataDir
And this time, the result is fascinating. R is plotting histogram in a split of a second, simply meaning it takes advantage of XDF file and inject it to Power BI.

This is still – an outer file or dataset -, that Power BI does not have a clue about. Meaning, no slicers are available for dynamic change of the user selection.
Let’s try to insert the data into those three dummy variables, where the third one will be a factor that I have to pre-prepare. Since in this case factor is Year, it is relatively easy to do:
library(RevoScaleR)
library(gridExtra)
library(dplyr)
Year % filter(year == c("2000","2001","2002")))
grid.table(df_f %>% filter(year == Year))
Once I have this inserted in new R visualize, I just need to add a dummy slicer.
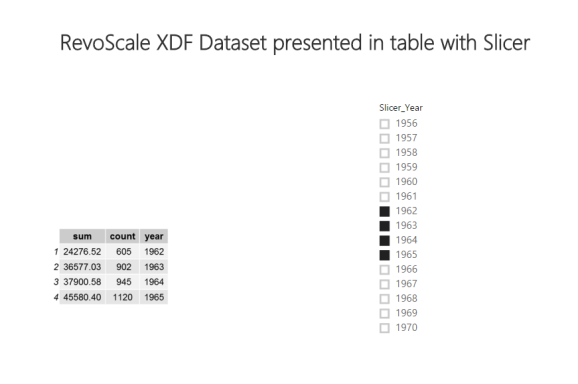
Now, I can easily change the years for my cross-tabulation (using rxCrosstab function). Since calculation is comprehended in the back on the whole dataset and using dplyr package just to omit or filter the results, it is also possible to use rxDatastep:
rxDataStep(inData=outputFile, outFile="C:\\Files\\YearPredictMSD_Year.xdf",
             overwrite=TRUE, transforms=list(LateYears = V1 > 1999))
rxCrossTabs(V2~F(LateYears), data = "C:\\Files\\YearPredictMSD_Year.xdf")
In this way, you will be creating new XDF file through PowerBI with the transformation. Bear in mind, that this step might take some extra seconds to create new variable or to make a subset, if you would need. Again, this is up to you to decide, based on the file size.
Using SQL Server procedure with R Script
This approach is not that uncommon, because it has been proven that using Stored Procedures with T-SQL and R code is useful and powerful way to use SQL Server and R integration within SSRS. Changing the computational context is sure another way to make a work around.
Creating Stored procedure:
CREATE PROCEDURE [dbo].[SP_YearMSD_CrossTab]
AS
BEGIN
    DECLARE @RScript nvarchar(max)
        SET @RScript = N'
                library(RevoScaleR)
                sampleDataDir
Or by copying the T-SQL Code into the SQL Server Data Source, the result is the same.
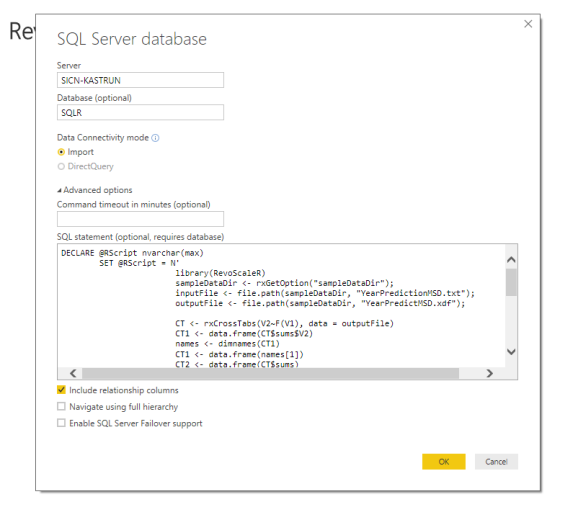
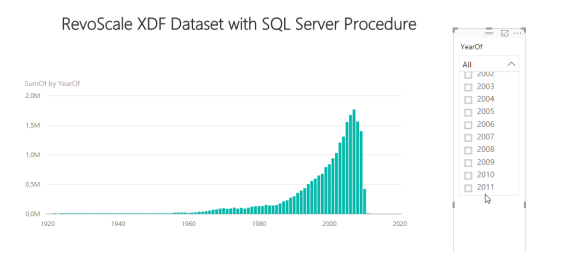
In both cases, you should have a cross-tabulational representation of XDF dataset within Power BI. And now you can really use all the advantages of Power BI visuals, Slicers and as well any additional R predictions.
There is a slight minus to this (if not all) approaches like this. You need to have many stored procedures or queries having generated like this. Also rxCube will help you to some extent, but repetitive work will not be avoided.
Using HDInsight or Hadoop?
Using XDF data files stored in HD-Insight or in Hadoop would generaly mean using same dataset and step as for SQL Server procedure. Just that you would need to – prior to executing T-SQL script, also change comptutational context:
# HD Insight - Spark - Azure
HDInsight mySshUsername = USNM,mySshHostname = HSTNM,
mySshSwitches= SWTCH)
rxSetComputeContext("HDInsight")
## Hadoop
Hadoop mySshUsername = USNM,mySshHostname = HSTNM,
mySshSwitches= SWTCH)
rxSetComputeContext("Hadoop")
Verdict
I have explored couple of ways how to use the Power BI visuals and environment with RevoScaleR XDF (eXternal Data Frame) datafiles. I have to admit, I was surprised that there will be a way to do it in a relatively easy way, but from data scientist perspective, it is still some additional load and work before you can start with actual data analysis. Last two approaches (R script in Visuals and SQL Server Procedures) are by far the fastest and also take the advantage of using parallel and distributed computations that RevoScaleR package brings.
I would very strongly advise Microsoft and Power BI development team to add XDF plug-in to Power BI. Plug-in would work with metadata presentation of the data each time the computations should be used, the metadata would push the code against R Server to have results returned. This would, for sure be a great way to bring Big Data concept to Power BI Desktop.
As always, code and samples are available at GitHub.
Happy coding!

R-bloggers.com offers daily e-mail updates about R news and tutorials about learning R and many other topics. Click here if you're looking to post or find an R/data-science job.
Want to share your content on R-bloggers? click here if you have a blog, or here if you don't.