
How Do You Organise Your R Project? This Is What We Do.
Want to share your content on R-bloggers? click here if you have a blog, or here if you don't.
The Biometrics group at Telethon Kids Institute uses a standardised template project directory to manage our biostatistical consultation projects. This approach allows us to streamline our workflow, initiate projects, and produce professional looking reports directly from the statistical analysis platform minimising the time spent on the non-analytical aspects of our projects. This project structure is identical and successful for both simple and large-scale projects.
Although this workflow has been developed in R, the broader principles discussed here are applicable to any scripting language and non-coding projects alike. This blog is based on recent presentations that I made at the UserR!2019, Toulouse, France (lightning talk) and the 40th Annual Conference of the International Society for Clinical Biostatistics (ISCB40), Leuven, Belgium (winner of best poster award) conferences in July 2019.
Project Directory Structure
We have developed and refined the skeleton of a template project that contains a series of sub-directories with distinct objectives that cover all steps of a project from initial import of raw data to reporting. Our template is pre-populated with directories and starter-files that has enabled our group to save time in project initiation, preliminary analysis, analysis, and reporting.

This structure is based on what is described by the “ProjectTemplate” R package (http://projecttemplate.net/index.html). We have found this structure to be attractive thanks to its automated project initiation, executing data wrangling scripts, and loading library packages and data. Without going into excessive detail, we have several directories including:
- Directories to house data at various stages of rawness, cleanliness, and wrangling
- admin directories for project meta data
- 2 scripting directories (ProjectTemplate can be configured to automatically run scripts in the munge directory; the R directory can be reproduced/changed for different scripting languages or changed to a generic “src” folder)
- and the vignettes folder for our reports.
This structure is also useful as it allows us to build our projects as R packages that are easily distributed to our collaborators once the analysis is complete. We chose to build our reports in the vignettes directory rather than locate them in a “reports” sub‑directory since we can share the final work as an installable package – enabling us to make a collection of project reports available to our collaborators by browsing the package vignettes. Packaging projects is also a useful way to share the cleaned data as it is available as an included dataset along with any documentation that was created specifically for the analysis.
options(ProjectTemplate.templatedir = “path/to/templates")
create.project(paste(“path/to/projects”, “00_project”, sep = “/”), template = "biometrics_project")
Box 1. It only takes 2 lines of code to initiate a new project. A template directory can contain multiple project templates.
Reproducible Research
It is important that our analysis is traceable from raw data to final report and that all changes that were made to the analysis throughout the project life cycle are tracked. I suggest that no modifications are made to the raw data once it is received from the researcher (which often comes as a .xlsx or a .csv). The first thing to do once data is received is to prefix the file name with the current date (YYYYMMDD_) then make it read-only. Any further cleaning is then performed in-script where all changes are documented and can be verified and audited. Subsequent changes to the analysis are tracked via. GitLab, which we have installed on our secure servers, or If the data isn’t sensitive then services such as GitHub or Bit Bucket.
Reporting with R Markdown
R Markdown is an excellent tool that allows analysts to compose the project narration and data analysis output in a single document. Markdown also helps to maintain the quality of a report; by keeping the analysis data frames and the report commentary all within in the R environment. Inserting the analysis outputs directly into the report removes the possibility of transcription errors. Markdown is also great for updating reports when minor changes have been made to the underlying data.
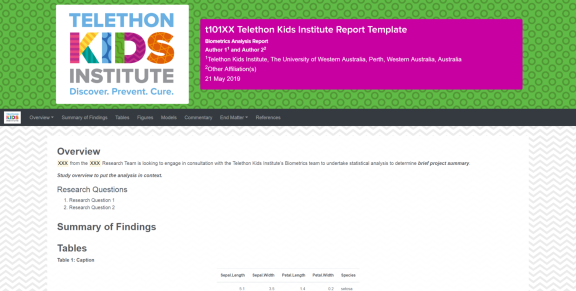
To streamline our analysis plans and reporting we have developed a series of R markdown templates that produce documents that conform to the Telethon Kids Institute’s style guide and online branding. These reports produce beautiful stand-alone HTML documents that we distribute to our collaborators and are built on the bootstrap CSS libraries which allow for dynamic responsive pages that can be viewed on a range of devices.
Toolbox
The following table lists some packages that we use to simplify our reporting. These packages are useful as they allow us to focus on the data without wasting time on the non-analytical parts of the project such as package citations, caption numbering, and tabulating and visualising model output. A brief description is provided about why we use each of these packages, you should visit the official documentation for further details.
Table 1. Summary of useful packages that we use during our professional biostatistical consultations.
| Package | Description |
| Tidyverse collection | Data wrangling/summaries/visualisation |
| Captioner | Cross-reference tables/figures/models |
| KableExtra | Nicely format data frames for reporting |
| Stargazer | Create well-formatted regression tables |
| Broom | Extract a model’s estimates and statistics |
| Repmis | Create a bibliography of loaded packages |
| Devtools::build_vignettes() | Knit all vignette .Rmd files |
| jtools::plot_summs() | Visualise a model(s) effect estimates and CIs |
| Gggally::ggpairs() | Look at your data with a plot pair matrix |
| roxygen2 | Documenting code by writing .Rd files in the man/ directory |
The default project directory structure that we have developed can be seen in action as part of the Telethon Kids rstudio GitHub repository; this repo is an implementation of R Studio within a Docker container (see here and here). You can navigate through the repo on GitHub, or clone it to your local machine. The template project is found in the projects/00_next_project sub-directory. Each of the sub-directories in this template contain a README that briefly describes its purpose.
Disclaimer
I doubt there will be anything in this article that can be called “new”, but unless someone has worked in a place with a clearly defined project structure then it is unlikely they have thought about an efficient way to organise their myriad of relates files (documents/data/scripts).
Conversations that I had with data scientists, statisticians, and analysts at both the UseR!2019 and ISCB40 conferences indicate that organisations are becoming increasingly aware of the importance of well-structured data projects. This workflow has come from reading many articles and trying out several packages – very few of which I recorded; thus, unfortunately, I am using other people’s ideas/concepts without proper acknowledgement. I don’t claim anything in this article as my original work and if you know of any authoritative sources on this content then please leave a comment.
There is a plethora of other sub-directories that could be included in a template project. For example, a figures directory for high resolution publication-ready images is a worthy inclusion. I am interested in how do YOU structure your projects; leave a comment and let me know what tools you use and how you increase throughput to ease your workload.
R-bloggers.com offers daily e-mail updates about R news and tutorials about learning R and many other topics. Click here if you're looking to post or find an R/data-science job.
Want to share your content on R-bloggers? click here if you have a blog, or here if you don't.