
Grid point occurrence records onto a raster
Want to share your content on R-bloggers? click here if you have a blog, or here if you don't.
The ‘gridRecords‘ function, which has just been added to the ‘fuzzySim‘ package (from version 2.6 on), takes a raster stack and a set of spatial coordinates of a species’ presence (and optionally absence) records, and returns a data frame with the presences and absences, as well as the corresponding values of the rasters in the grid of pixels (cells). If absence coordinates are not supplied, all pixels without any presence point will be returned as absences. A precursor of this function was used in Báez et al. (2020) for getting unique presences and absences from point occurrence data at the spatial resolution of marine raster variables. The function can be especially useful for using point + raster data to compute presence-absence models with packages or functions that normally require data frames as input, such as glm, multGLM, gam or randomForest.
gridRecords <- function(rst,
                        pres.coords,
                        abs.coords = NULL,
                        na.rm = TRUE) {

  # version 2.0 (3 Feb 2020)

  if (!requireNamespace("raster")) stop("This function requires installing the 'raster' package first.")

  if (is.null(abs.coords)) {
    abs.coords <- raster::coordinates(rst)
  }

  p_extract <- raster::extract(rst, pres.coords, cellnumbers = TRUE, df = TRUE)[ , -1]
  a_extract <- raster::extract(rst, abs.coords, cellnumbers = TRUE, df = TRUE)[ , -1]

  p_extract <- unique(p_extract)
  a_extract <- unique(a_extract)

  a_extract <- a_extract[!(a_extract$cells %in% p_extract$cells), ]

  p_centroids <- raster::xyFromCell(rst, p_extract$cells)
  a_centroids <- raster::xyFromCell(rst, a_extract$cells)

  p_extract <- data.frame(presence = 1, p_centroids, p_extract)
  if (nrow(a_extract) > 0) {
    a_extract <- data.frame(presence = 0, a_centroids, a_extract)
  }

  result <- rbind(p_extract, a_extract)

  if (na.rm) {
    result_NA <- which(apply(result[ , 5:ncol(result)], MARGIN = 1, FUN = function(x) all(is.na(x))))
    if (length(result_NA) > 0) {
      result <- result[-result_NA, ]
    }
  }

  return(result)
}
Usage example:
library(raster)
library(fuzzySim) # >= 2.6
# import a system raster with 3 layers and crop it to a smaller extent:
rst <- stack(system.file("external/rlogo.grd", package = "raster"))
ext <- extent(c(0, 15, 25, 40))
rst <- crop(rst, ext)
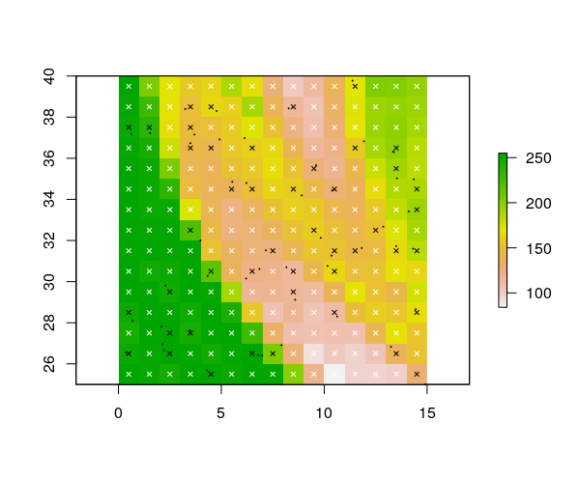
plot(rst)
plot(rst[[1]])
# generate some random presence and absence points:
set.seed(123)
presences <- sp::spsample(as(ext, "SpatialPolygons"), 50, type = "random")
absences <- sp::spsample(as(ext, "SpatialPolygons"), 50, type = "random")
points(presences, pch = 20, cex = 0.2, col = "black")
points(absences, pch = 20, cex = 0.2, col = "white")
# use 'gridRecords' on these random points:
gridded_pts <- gridRecords(rst, coordinates(presences), coordinates(absences))
head(gridded_pts) # 'red', 'green' and 'blue' are the names of the layers in 'rst'
# plot them to check the result:
pres_coords <- gridded_pts[gridded_pts$presence == 1, c("x", "y")]
abs_coords <- gridded_pts[gridded_pts$presence == 0, c("x", "y")]
points(gridded_pts[ , c("x", "y")], pch = 4, cex = 0.6, col = gridded_pts$presence)

# you can also do it with only presence (no absence) records:
gridded_pres <- gridRecords(rst, coordinates(presences))
head(gridded_pres)
plot(rst[[1]])
points(presences, pch = 20, cex = 0.2, col = "black")
pres_coords <- gridded_pres[gridded_pres$presence == 1, c("x", "y")]
abs_coords <- gridded_pres[gridded_pres$presence == 0, c("x", "y")]
points(gridded_pres[ , c("x", "y")], pch = 4, cex = 0.6, col = gridded_pres$presence)
References
Baez J.C., Barbosa A.M., Pascual P., Ramos M.L. & Abascal F. (2020) Ensemble modelling of the potential distribution of the whale shark in the Atlantic Ocean. Ecology and Evolution, 10: 175-184
R-bloggers.com offers daily e-mail updates about R news and tutorials about learning R and many other topics. Click here if you're looking to post or find an R/data-science job.
Want to share your content on R-bloggers? click here if you have a blog, or here if you don't.