
FUNCTIONS FOR EXPLORING A DATAFRAME IN R
Want to share your content on R-bloggers? click here if you have a blog, or here if you don't.
The data are stored in dataframes in R. Dataframes are capable of storing different types of data.
Dataset Used: The default dataset available in datasets package named ‘quakes‘ which gives the locations of Earthquakes in Fiji
This dataframe contains 1000 observations on 5 numerical variables.
[,1] lat numeric Latitude of event
[,2] long numeric Longitude
[,3] depth numeric Depth (km)
[,4] mag numeric Richter Magnitude
[,5] stations numeric Number of stations reporting
Lets start exploring,
To view the dataframe in a spreadsheet format
> View(quakes)
The dimension of the dataframe can be obtained using the dim() which gives a vector as its output:
> dim(quakes)
[1] 1000 5
The detailed description and structure of the objects in the dataframe can be obtained using str()
> str(quakes)
‘data.frame’: 1000 obs. of 5 variables:
$ lat : num -20.4 -20.6 -26 -18 -20.4 …
$ long : num 182 181 184 182 182 …
$ depth : int 562 650 42 626 649 195 82 194 211 622 …
$ mag : num 4.8 4.2 5.4 4.1 4 4 4.8 4.4 4.7 4.3 …
$ stations: int 41 15 43 19 11 12 43 15 35 19 …
The number of rows and columns can be obtained using the nrow() and ncol()
> nrow(quakes)
[1] 1000
> ncol(quakes)
[1] 5
The first n observations in the dataframe can be displayed using the head()
> head(quakes)
———-lat long depth mag stations
1 -20.42 181.62 562 4.8 41
2 -20.62 181.03 650 4.2 15
3 -26.00 184.10 42 5.4 43
4 -17.97 181.66 626 4.1 19
5 -20.42 181.96 649 4.0 11
6 -19.68 184.31 195 4.0 12
Note: If you need only first 3 observations, then specify that in the function
> head(quakes,3)
———-lat long depth mag stations
1 -20.42 181.62 562 4.8 41
2 -20.62 181.03 650 4.2 15
3 -26.00 184.10 42 5.4 43
The last n observations can be displayed using the tail()
> tail(quakes)
———-lat long depth mag stations
995 -17.70 188.10 45 4.2 10
996 -25.93 179.54 470 4.4 22
997 -12.28 167.06 248 4.7 35
998 -20.13 184.20 244 4.5 34
999 -17.40 187.80 40 4.5 14
1000-21.59 170.56 165 6.0 119
Note: If you need only last 3 observations, then specify that in the function
> tail(quakes,3)
———–lat long depth mag stations
998 -20.13 184.20 244 4.5 34
999 -17.40 187.80 40 4.5 14
1000-21.59 170.56 165 6.0 119
To get the column headers, use the names()
> names(quakes)
[1] “lat” “long” “depth” “mag” “stations”
To get the number of NA values in a dataframe,
> apply(quakes,2,function(x) sum(is.na(x)))
lat long depth mag stations
0 0 0 0 0
The result summary can be displayed with the help of the summary()
> summary(quakes)
——lat long depth mag stations
Min. :-38.59 Min. :165.7 Min. : 40.0 Min. :4.00 Min. : 10.00
1st Qu. :-23.47 1st Qu. :179.6 1st Qu. : 99.0 1st Qu. :4.30 1st Qu. : 18.00
Median:-20.30 Median:181.4 Median:247.0 Median:4.60 Median: 27.00
Mean :-20.64 Mean :179.5 Mean :311.4 Mean :4.62 Mean : 33.42
3rd Qu.:-17.64 3rd Qu. :183.2 3rd Qu. :543.0 3rd Qu. :4.90 3rd Qu. : 42.00
Max. :-10.72 Max. :188.1 Max. :680.0 Max. :6.40 Max. :132.00
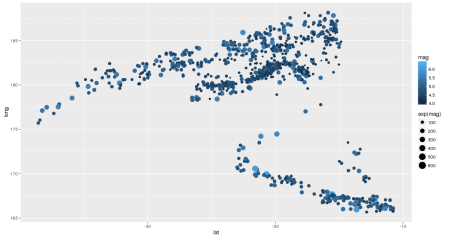
To plot a graph between Latitude vs Longitude based on the Richter scale magnitudes
library(ggplot2)
qplot(data = quakes, x = lat, y = long, size = exp(mag), color = mag)

R-bloggers.com offers daily e-mail updates about R news and tutorials about learning R and many other topics. Click here if you're looking to post or find an R/data-science job.
Want to share your content on R-bloggers? click here if you have a blog, or here if you don't.