
FileTable and storing graphs from Microsoft R Server
Want to share your content on R-bloggers? click here if you have a blog, or here if you don't.
FileTable has been around now for quite some time and and it is useful for storing files, documents, pictures and and binary files in a designated SQL Server table – FileTable. The best part of FileTable is the fact one can access it from windows or other application as if it were stored on file system (because they are) and not making any other changes on the client.
And this feature is absolutely handy for using and storing outputs from Microsoft R Server. In this blog post I will focus mainly on persistently storing charts from statistical analysis.
First we need to secure that FileStream is enabled. Open SQL Server Configuration Manager and navigate to your running SQL Server. Right click and select FILESTREAM and enable Filestream for T-SQL access and I/O access. In addition, allow remote clients access to Filestream data as well.

Next step is to enable the configurations in Management Studio.
EXEC sp_configure 'filestream_access_level' , 2;
GO
RECONFIGURE;
GO
For this purpose I have decided to have a dedicated database for storing charts created in R. And this database will have FileTable enabled.
USE master;
GO

CREATE DATABASE FileTableRChart
ON PRIMARY  (NAME = N'FileTableRChart', FILENAME = N'C:\Program Files\Microsoft SQL Server\MSSQL13.MSSQLSERVER\MSSQL\DATA\FileTableRChart.mdf' , SIZE = 8192KB , FILEGROWTH = 65536KB ),
FILEGROUP FileStreamGroup1 CONTAINS FILESTREAM( NAME = ChartsFG, FILENAME = 'C:\Program Files\Microsoft SQL Server\MSSQL13.MSSQLSERVER\MSSQL\DATA\RCharts')
LOG ON (NAME = N'FileTableRChart_log', FILENAME = N'C:\Program Files\Microsoft SQL Server\MSSQL13.MSSQLSERVER\MSSQL\DATA\FileTableRChart_log.ldf' , SIZE = 8192KB , FILEGROWTH = 65536KB )
GO

ALTER DATABASE FileTableRChart
    SET FILESTREAM ( NON_TRANSACTED_ACCESS = FULL, DIRECTORY_NAME = N'RCharts' )
So I will have folder RCharts available as a BLOB storage to my FileTableRChart SQL server database. Adding a table to get all the needed information on my charts.
USE FileTableRChart;
GO

CREATE TABLE ChartsR AS FILETABLE
WITH (
 FileTable_Directory = 'DocumentTable'
,FileTable_Collate_Filename = database_default
);
GO
Setting the BLOB, we can focus now on R code within T-SQL. Following R Code will be used to generated histograms with normal curve for quick data overview (note, this is just a sample):
x <- data.frame(val = c(1,2,3,6,3,2,3,4,5,6,7,7,6,6,6,5,5,4,8))
y <- data.frame(val = c(1,2,5,8,5,4,2,4,5,6,3,2,3,5,5,6,7,7,8))
x$class <- 'XX'
y$class <- 'YY'
d <- rbind(x,y)

#normal function with counts
gghist <- ggplot(d, aes(x=val)) + geom_histogram(binwidth=2,
                  aes(y=..density.., fill=..count..))
gghist <- gghist + stat_function(fun=dnorm, args=list(mean=mean(d$val),
                   sd=sd(d$val)), colour="red")
gghist <- gghist + ggtitle("Histogram of val with normal curve")  +
                   xlab("Variable Val") + ylab("Density of Val")
Returning diagram that will be further parametrized when inserted into T-SQL code.

Besides parametrization, I will add a function to loop through all the input variables and generated diagrams for each of the given variable/column in SQL Server query passed through sp_execute_external_script stored procedure.
Final code:
DECLARE @SQLStat NVARCHAR(4000)
SET @SQLStat = 'SELECT
                     fs.[Sale Key] AS SalesID
                    ,c.[City] AS City
                    ,c.[State Province] AS StateProvince
                    ,c.[Sales Territory] AS SalesTerritory
                    ,fs.[Customer Key] AS CustomerKey
                    ,fs.[Stock Item Key] AS StockItem
                    ,fs.[Quantity] AS Quantity
                    ,fs.[Total Including Tax] AS Total
                    ,fs.[Profit] AS Profit

                    FROM [Fact].[Sale] AS  fs
                    JOIN dimension.city AS c
                    ON c.[City Key] = fs.[City Key]
                    WHERE
                        fs.[customer key] <> 0'

DECLARE @RStat NVARCHAR(4000)
SET @RStat = 'library(ggplot2)
              library(stringr)
              #library(jpeg)
              cust_data <- Sales
              n <- ncol(cust_data)
              for (i in 1:n)
                        {
                          path <-
''\\\\SICN-KASTRUN\\mssqlserver\\RCharts\\DocumentTable\\Plot_''
                          colid   <- data.frame(val=(cust_data)[i])
                          colname <- names(cust_data)[i]
                          #print(colname)
                          #print(colid)
                          gghist <- ggplot(colid, aes(x=val)) +
geom_histogram(binwidth=2, aes(y=..density.., fill=..count..))
                          gghist <- gghist + stat_function(fun=dnorm,
args=list(mean=mean(colid$val), sd=sd(colid$val)), colour="red")
                          gghist <- gghist + ggtitle("Histogram of val with
normal curve")  + xlab("Variable Val") + ylab("Density of Val")
                          path <- paste(path,colname,''.jpg'')
                          path <- str_replace_all(path," ","")
                          #jpeg(file=path)
                          ggsave(path, width = 4, height = 4)
                          plot(gghist)
                          dev.off()
                        }';

EXECUTE sp_execute_external_script
     @language = N'R'
    ,@script = @RStat
    ,@input_data_1 = @SQLStat
    ,@input_data_1_name = N'Sales'
I am using ggsave function, but jpeg function from package jpeg is also an option. Matter of a flavour. And variable path should be pointing to your local FileTable directory.
Now I can have graphs and charts stored persistently in filetable and retrieving information on files with simple query:
SELECT FT.Name
,IIF(FT.is_directory=1,'Directory','Files') [File Category]
,FT.file_type [File Type]
,(FT.cached_file_size)/1024.0 [File Size (KB)]
,FT.creation_time [Created Time]
,FT.file_stream.GetFileNamespacePath(1,0) [File Path]
,ISNULL(PT.file_stream.GetFileNamespacePath(1,0),'Root Directory') [Parent Path]
FROM [dbo].[ChartsR] FT
LEFT JOIN [dbo].[ChartsR] PT
ON FT.path_locator.GetAncestor(1) = PT.path_locator
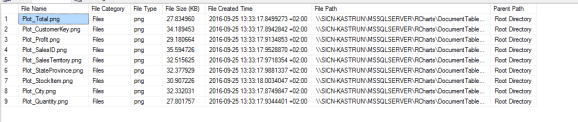
Going through the charts could be now much easier for multiple purposes.

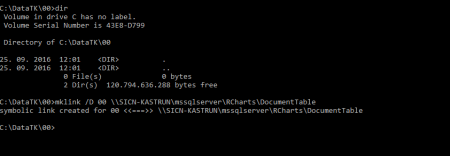
There might be some security issues: I have used mklink to create a logical drive pointing to FileTable directory.
You might also want to use Local group policy editor for MSSQLLaunchpad to have access granted (write permissions) to FileTable directory.

Code is available at GitHub.
Happy R-SQLing!

R-bloggers.com offers daily e-mail updates about R news and tutorials about learning R and many other topics. Click here if you're looking to post or find an R/data-science job.
Want to share your content on R-bloggers? click here if you have a blog, or here if you don't.