
Download Fantasy Football Projections from ESPN.com using R
[This article was first published on Fantasy Football Analytics in R, and kindly contributed to R-bloggers]. (You can report issue about the content on this page here)
Want to share your content on R-bloggers? click here if you have a blog, or here if you don't.
In this post, I will demonstrate how to download fantasy football projections from ESPN.com using R. Having projections allows us to do many different analyses to determine our best possible fantasy team. The projections on ESPN.com are currently from last year—they haven’t been updated yet for the upcoming season. ESPN will update them closer to the start of the season. In the meantime, last year’s projections can be helpful for determining their accuracy.Want to share your content on R-bloggers? click here if you have a blog, or here if you don't.
An important note of caution: the ESPN projections do not include fumbles. If you know where ESPN includes projection data for fumbles, please let me know.
The R Script
The R Script for downloading fantasy football projections from ESPN.com is located at: https://github.com/dadrivr/FantasyFootballAnalyticsR/blob/master/R%20Scripts/ESPN%20Projections.R
To scrape the ESPN projections from the ESPN.com website, we will use the readHTMLTable function from the XML package in R.
To scrape the ESPN projections from the ESPN.com website, we will use the readHTMLTable function from the XML package in R.
#Download fantasy football projections from ESPN.com
qb_espn <- readHTMLTable("http://games.espn.go.com/ffl/tools/projections?&seasonTotals=true&seasonId=2012&slotCategoryId=0", stringsAsFactors = FALSE)$playertable_0
rb1_espn <- readHTMLTable("http://games.espn.go.com/ffl/tools/projections?&seasonTotals=true&seasonId=2012&slotCategoryId=2", stringsAsFactors = FALSE)$playertable_0
rb2_espn <- readHTMLTable("http://games.espn.go.com/ffl/tools/projections?&seasonTotals=true&seasonId=2012&slotCategoryId=2&startIndex=40", stringsAsFactors = FALSE)$playertable_0
rb3_espn <- readHTMLTable("http://games.espn.go.com/ffl/tools/projections?&seasonTotals=true&seasonId=2012&slotCategoryId=2&startIndex=80", stringsAsFactors = FALSE)$playertable_0
wr1_espn <- readHTMLTable("http://games.espn.go.com/ffl/tools/projections?&seasonTotals=true&seasonId=2012&slotCategoryId=4", stringsAsFactors = FALSE)$playertable_0
wr2_espn <- readHTMLTable("http://games.espn.go.com/ffl/tools/projections?&seasonTotals=true&seasonId=2012&slotCategoryId=4&startIndex=40", stringsAsFactors = FALSE)$playertable_0
wr3_espn <- readHTMLTable("http://games.espn.go.com/ffl/tools/projections?&seasonTotals=true&seasonId=2012&slotCategoryId=4&startIndex=80", stringsAsFactors = FALSE)$playertable_0
te_espn <- readHTMLTable("http://games.espn.go.com/ffl/tools/projections?&seasonTotals=true&seasonId=2012&slotCategoryId=6", stringsAsFactors = FALSE)$playertable_0
See the full R script to see how the data were processed to be more usable.
What do the data look like?
head(projections_espn)
Here are the first 6 lines of the data set:name pos passYd passTD passINT rushYd rushTD recYd recTD pts
1 Aaron Rodgers QB 4512 43 7 216 4 0 0 381
2 Tom Brady QB 4924 40 13 167 2 0 0 354
3 Drew Brees QB 4921 41 14 50 2 0 0 345
4 Matthew Stafford QB 5012 41 17 60 1 0 0 338
5 Cam Newton QB 3986 22 18 742 8 0 0 325
6 Arian Foster RB 0 0 0 1459 12 730 2 296
Five out of the top 6 projected players from last year were quarterbacks. As I will discuss in a future post, however, the number of points a player scores is not as important as how many points he scores relative to a typical replacement starter at his position.
Below is a density plot of ESPN's projected points. On the x- axis is the number of projected points for a given player. On the y-axis is the frequency of players with that number of projected points. The density plot shows a distribution similar to a zero-inflated Poisson or negative binomial distribution, where there are many players with 0 projected points, a peak around 50 points, and then a sharp decrease in the frequency until it tapers off above 250 points.
ggplot(projections_espn, aes(x=pts_espn)) + geom_density(fill="blue", alpha=.3) + xlab("Player's Projected Points") + ggtitle("Density Plot of ESPN Projected Points from 2012")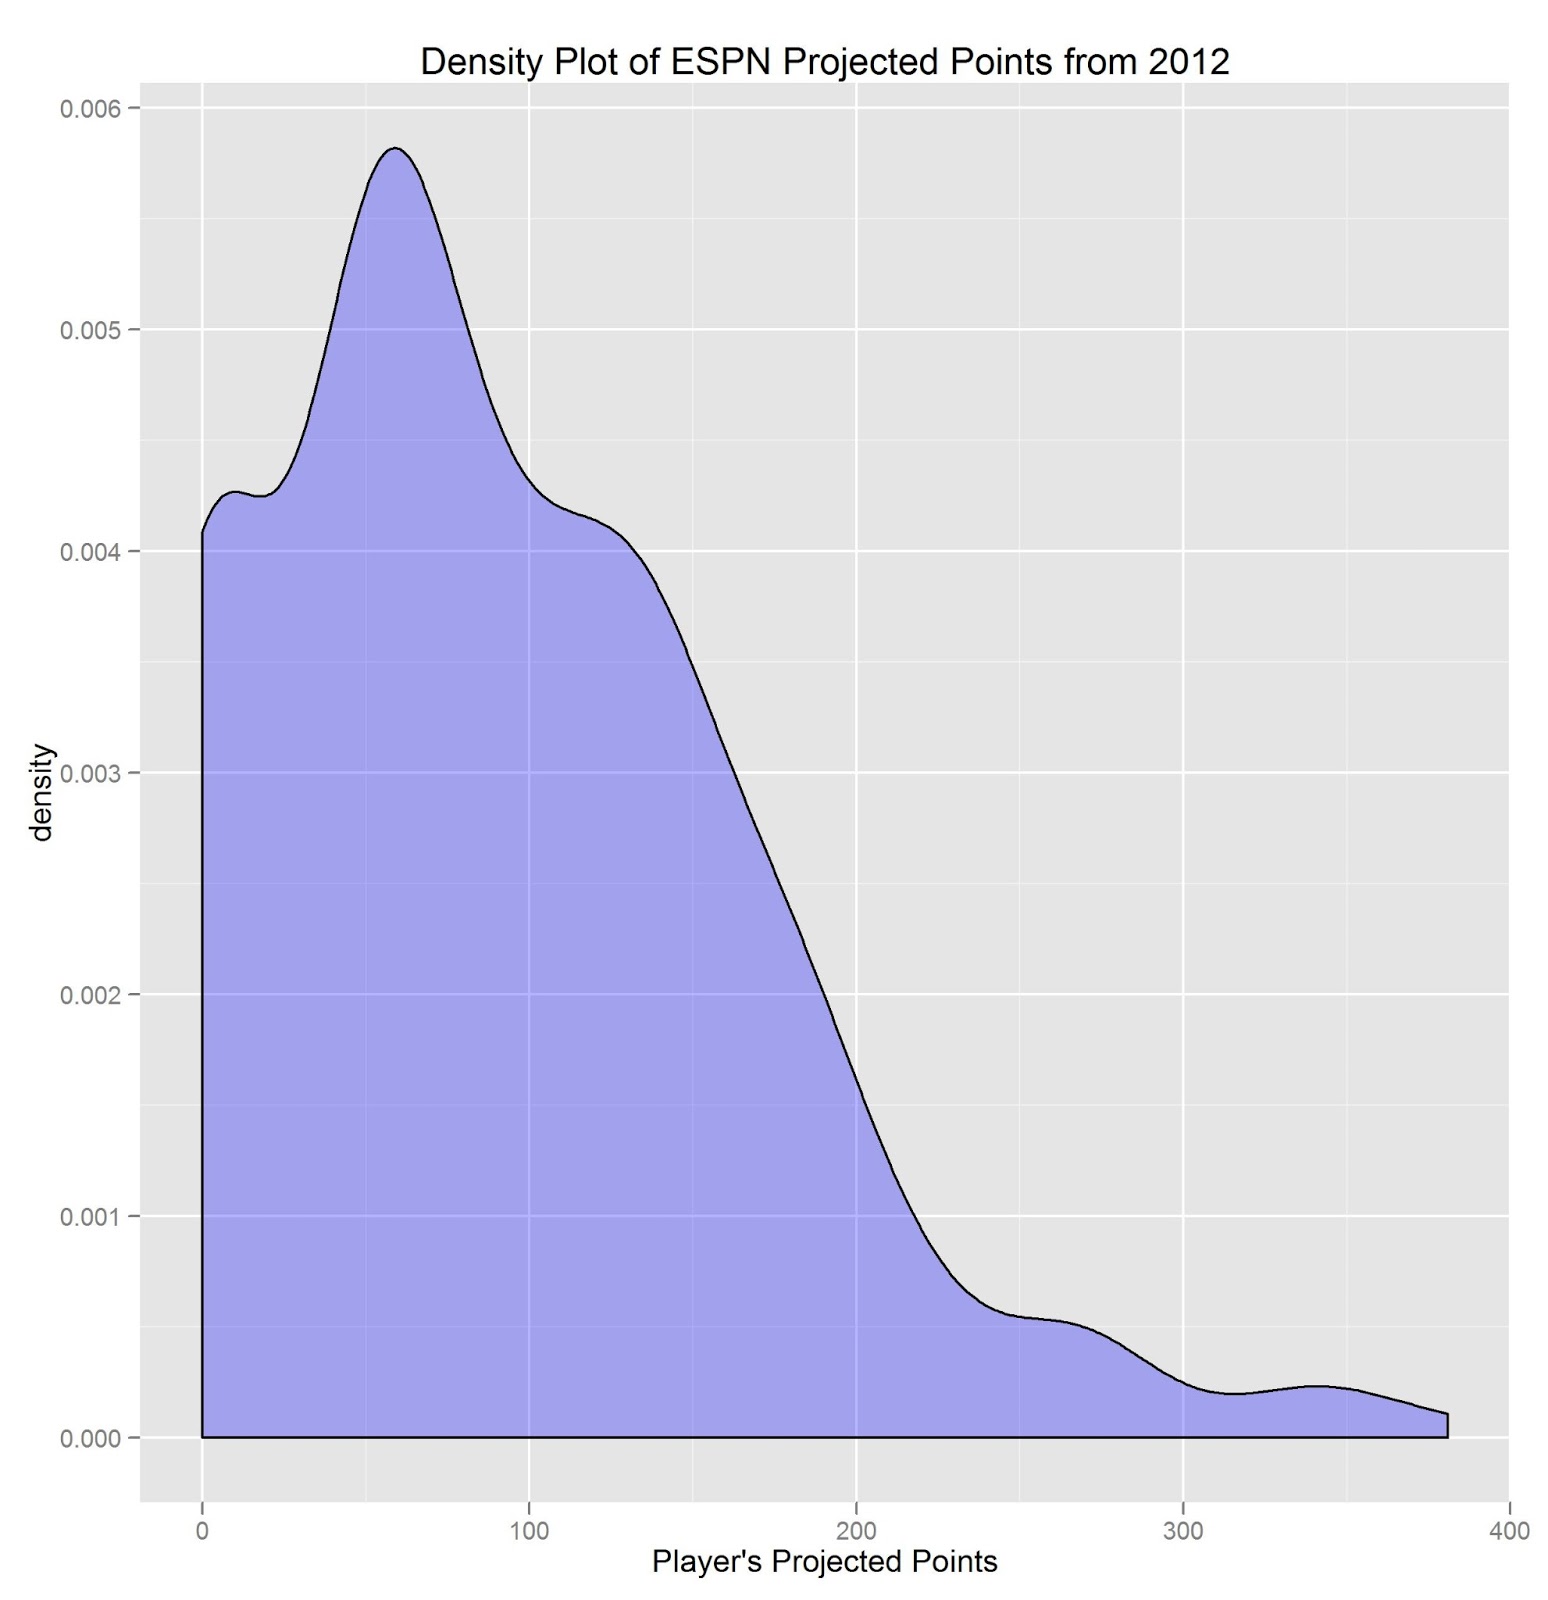
To leave a comment for the author, please follow the link and comment on their blog: Fantasy Football Analytics in R.
R-bloggers.com offers daily e-mail updates about R news and tutorials about learning R and many other topics. Click here if you're looking to post or find an R/data-science job.
Want to share your content on R-bloggers? click here if you have a blog, or here if you don't.