
Averaged Input Assumptions and Momentum
Want to share your content on R-bloggers? click here if you have a blog, or here if you don't.
Today I want to share another interesting idea contributed by Pierre Chretien. Pierre suggested using Averaged Input Assumptions and Momentum to create reasonably quiet strategy. The averaging techniques are used to avoid over-fitting any particular frequency.
To create Averaged Input Assumptions we combine returns over different look-back periods, giving more weight to the recent returns, to form overall Input Assumptions.
create.ia.averaged <- function(lookbacks, n.lag) {
	lookbacks = lookbacks
	n.lag = n.lag

	function(hist.returns, index=1:ncol(hist.returns), hist.all)
	{
		nperiods = nrow(hist.returns)

		temp = c()
		for (n.lookback in lookbacks)
			temp = rbind(temp, hist.returns[(nperiods - n.lookback - n.lag + 1):(nperiods - n.lag), ])
		create.ia(temp, index, hist.all)
	}
}
To create Averaged Momentum we take a look-back weighted avaerage of momentums computed over different look-back periods.
momentum.averaged <- function(prices,
	lookbacks = c(20,60,120,250) ,	# length of momentum look back
	n.lag = 3
) {
	momentum = 0 * prices
	for (n.lookback in lookbacks) {
		part.mom = mlag(prices, n.lag) / mlag(prices, n.lookback + n.lag) - 1
		momentum = momentum + 252 / n.lookback * part.mom
	}
	momentum / len(lookbacks)
}
Next let’s compare using historical Input Assumptions vs Averaged Input Assumptions and Momentum vs Averaged Momentum. I will consider Absolute Momentum (not cross sectional), for more information about relative and absolute momentum, please see
Absolute Momentum: A Simple Rule-Based Strategy and Universal Trend-Following Overlay, Gary Antonacci, 2013
Generalized Momentum and Flexible Asset Allocation (FAA): An Heuristic Approach by W.J. Keller and H. S. Van Putten 2012
###############################################################################
# Load Systematic Investor Toolbox (SIT)
# http://systematicinvestor.wordpress.com/systematic-investor-toolbox/
###############################################################################
setInternet2(TRUE)
con = gzcon(url('http://www.systematicportfolio.com/sit.gz', 'rb'))
source(con)
close(con)
#*****************************************************************
# Load historical data
#******************************************************************
load.packages('quantmod')
# 10 funds
tickers = spl('Us.Eq = VTI + VTSMX,
Eurpoe.Eq = IEV + FIEUX,
Japan.Eq = EWJ + FJPNX,
Emer.Eq = EEM + VEIEX,
Re = RWX + VNQ + VGSIX,
Com = DBC + QRAAX,
Gold = GLD + SCGDX,
Long.Tr = TLT + VUSTX,
Mid.Tr = IEF + VFITX,
Short.Tr = SHY + VFISX')
start.date = 1998
dates = paste(start.date,'::',sep='')
data <- new.env()
getSymbols.extra(tickers, src = 'yahoo', from = '1980-01-01', env = data, set.symbolnames = T, auto.assign = T)
for(i in data$symbolnames) data[[i]] = adjustOHLC(data[[i]], use.Adjusted=T)
bt.prep(data, align='keep.all', dates=paste(start.date-2,':12::',sep=''), fill.gaps = T)
#*****************************************************************
# Setup
#******************************************************************
prices = data$prices
n = ncol(prices)
nperiods = nrow(prices)
periodicity = 'months'
period.ends = endpoints(prices, periodicity)
period.ends = period.ends[period.ends > 0]
max.product.exposure = 0.6
#*****************************************************************
# Input Assumptions
#******************************************************************
lookback.len = 40
create.ia.fn = create.ia
# input assumptions are averaged on 20, 40, 60 days using 1 day lag
ia.array = c(20,40,60)
avg.create.ia.fn = create.ia.averaged(ia.array, 1)
#*****************************************************************
# Momentum
#******************************************************************
universe = prices > 0
mom.lookback.len = 120
momentum = prices / mlag(prices, mom.lookback.len) - 1
mom.universe = ifna(momentum > 0, F)
# momentum is averaged on 20,60,120,250 days using 3 day lag
mom.array = c(20,60,120,250)
avg.momentum = momentum.averaged(prices, mom.array, 3)
avgmom.universe = ifna(avg.momentum > 0, F)
#*****************************************************************
# Algos
#******************************************************************
min.risk.fns = list(
EW = equal.weight.portfolio,
MV = min.var.portfolio,
MCE = min.corr.excel.portfolio,
MV.RSO = rso.portfolio(min.var.portfolio, 3, 100, const.ub = max.product.exposure),
MCE.RSO = rso.portfolio(min.corr.excel.portfolio, 3, 100, const.ub = max.product.exposure)
)
#*****************************************************************
# Code Strategies
#******************************************************************
make.strategy.custom <- function(name, create.ia.fn, lookback.len, universe, env) {
obj = portfolio.allocation.helper(data$prices,
periodicity = periodicity,
universe = universe,
lookback.len = lookback.len,
create.ia.fn = create.ia.fn,
const.ub = max.product.exposure,
min.risk.fns = min.risk.fns,
adjust2positive.definite = F
)
env[[name]] = create.strategies(obj, data, prefix=paste(name,'.',sep=''))$models
}
models <- new.env()
make.strategy.custom('ia.none' , create.ia.fn , lookback.len, universe , models)
make.strategy.custom('ia.mom' , create.ia.fn , lookback.len, mom.universe , models)
make.strategy.custom('ia.avg_mom' , create.ia.fn , lookback.len, avgmom.universe, models)
make.strategy.custom('avg_ia.none' , avg.create.ia.fn, 252 , universe , models)
make.strategy.custom('avg_ia.mom' , avg.create.ia.fn, 252 , mom.universe , models)
make.strategy.custom('avg_ia.avg_mom' , avg.create.ia.fn, 252 , avgmom.universe, models)
#*****************************************************************
# Create Report
#*****************************************************************
strategy.snapshot.custom <- function(models, n = 0, title = NULL) {
if (n > 0)
models = models[ as.vector(matrix(1:len(models),ncol=n, byrow=T)) ]
layout(1:3)
plotbt(models, plotX = T, log = 'y', LeftMargin = 3, main = title)
mtext('Cumulative Performance', side = 2, line = 1)
plotbt.strategy.sidebyside(models)
barplot.with.labels(sapply(models, compute.turnover, data), 'Average Annual Portfolio Turnover', T)
}
# basic vs basic + momentum => momentum filter has better results
models.final = c(models$ia.none, models$ia.mom)
strategy.snapshot.custom(models.final, len(min.risk.fns), 'Momentum Filter')
# basic vs basic + avg ia => averaged ia reduce turnover
models.final = c(models$ia.none, models$avg_ia.none)
strategy.snapshot.custom(models.final, len(min.risk.fns), 'Averaged Input Assumptions')
# basic + momentum vs basic + avg.momentum => mixed results for averaged momentum
models.final = c(models$ia.mom, models$ia.avg_mom)
strategy.snapshot.custom(models.final, len(min.risk.fns), 'Averaged Momentum')
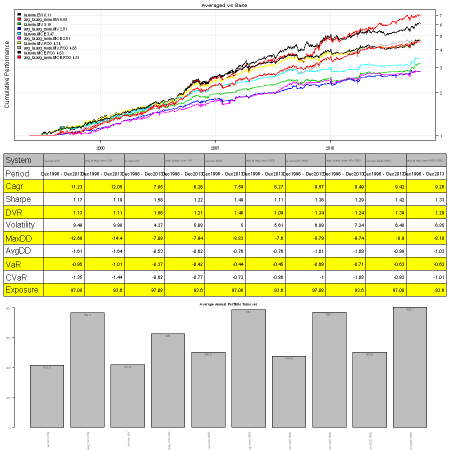
# basic + momentum vs avg ia + avg.momentum
models.final = c(models$ia.mom, models$avg_ia.avg_mom)
strategy.snapshot.custom(models.final, len(min.risk.fns), 'Averaged vs Base')
Above, I compared results for the following 4 cases:
1. Adding Momentum filter: all algos perfrom better

2. Input Assumptions vs Averaged Input Assumptions: returns are very similar, but using Averaged Input Assumptions helps reduce portfolio turnover.

3. Momentum vs Averaged Momentum: returns are very similar, but using Averaged Momentum increases portfolio turnover.

4. historical Input Assumptions + Momentum vs Averaged Input Assumptions + Averaged Momentum: results are mixed, no consistent advantage of using Averaged methods
Overall, the Averaged methods is a very interesting idea and I hope you will experiemtn with it and share your findings, like Pierre. Pierre, again thank you very much for sharing.
The full source code and example for the bt.averaged.test() function is available in bt.test.r at github.

R-bloggers.com offers daily e-mail updates about R news and tutorials about learning R and many other topics. Click here if you're looking to post or find an R/data-science job.
Want to share your content on R-bloggers? click here if you have a blog, or here if you don't.