Articles by Rsquared Academy Blog - Explore Discover Learn

Descriptive/Summary Statistics with descriptr

February 19, 2019 | Rsquared Academy Blog - Explore Discover Learn

We are pleased to introduce the descriptr package, a set of tools for generating descriptive/summary statistics. Installation
# Install release version from CRAN
install.packages("descriptr")

# Install development version from GitHub
# install.packages("devtools")
devtools::install_github("rsquaredacademy/descriptr")
Shiny App descriptr includes a shiny app which can be launched using
ds_launch_shiny_app()
or try the live version here. Read on to learn more about the features of descriptr, or see ...
[Read more...]

RFM Analysis in R

February 11, 2019 | Rsquared Academy Blog - Explore Discover Learn

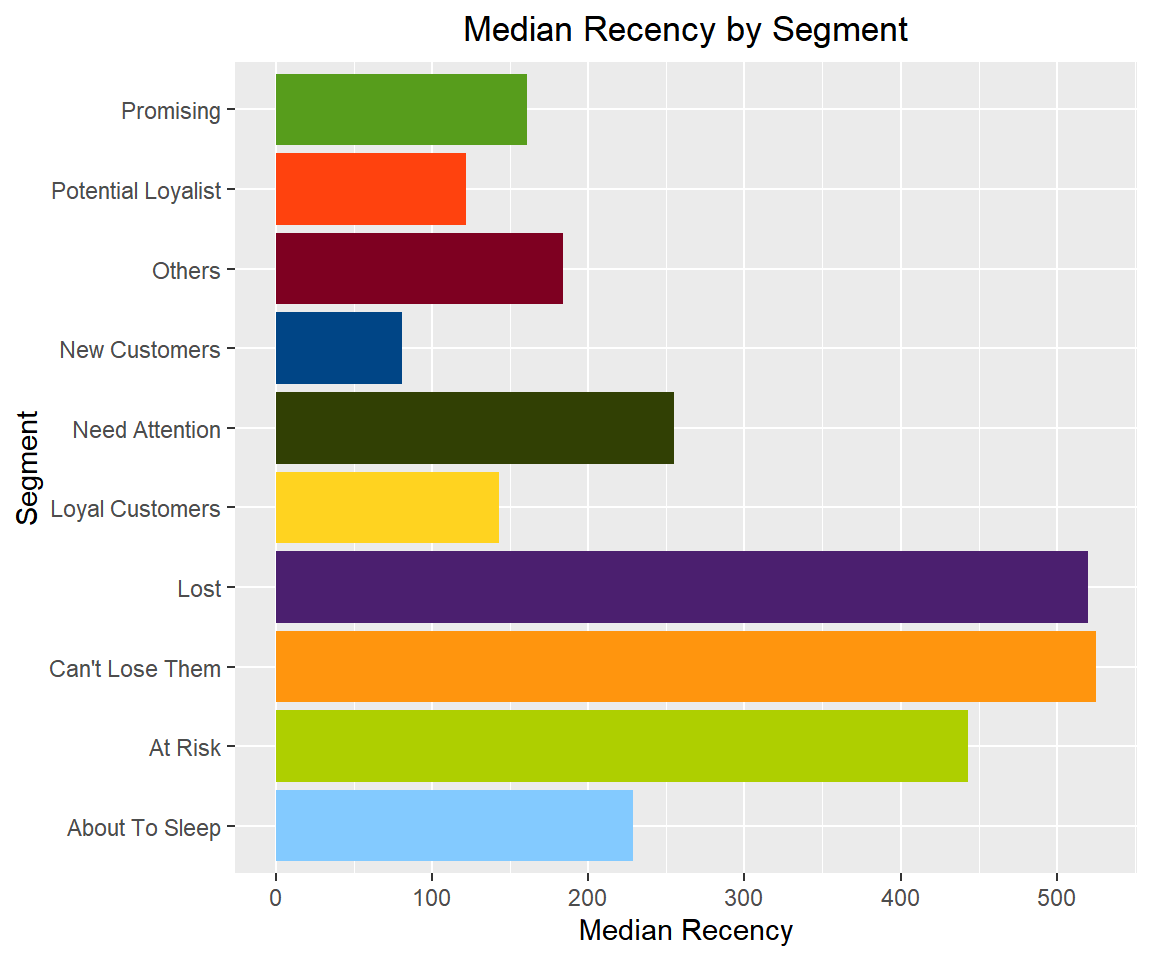
We are pleased to announce the rfm package, a set of tools for recency, frequency and monetary value analysis, designed keeping in mind beginner/intermediate R users. It can handle: transaction level data customer level data Installation
# Install release version from CRAN
install.packages("rfm")

# Install development version from GitHub
# install.packages("devtools")
devtools::install_github("rsquaredacademy/rfm")
Shiny App rfm includes a shiny app which can be launched using {{...
[Read more...]

Introducing olsrr

February 7, 2019 | Rsquared Academy Blog - Explore Discover Learn

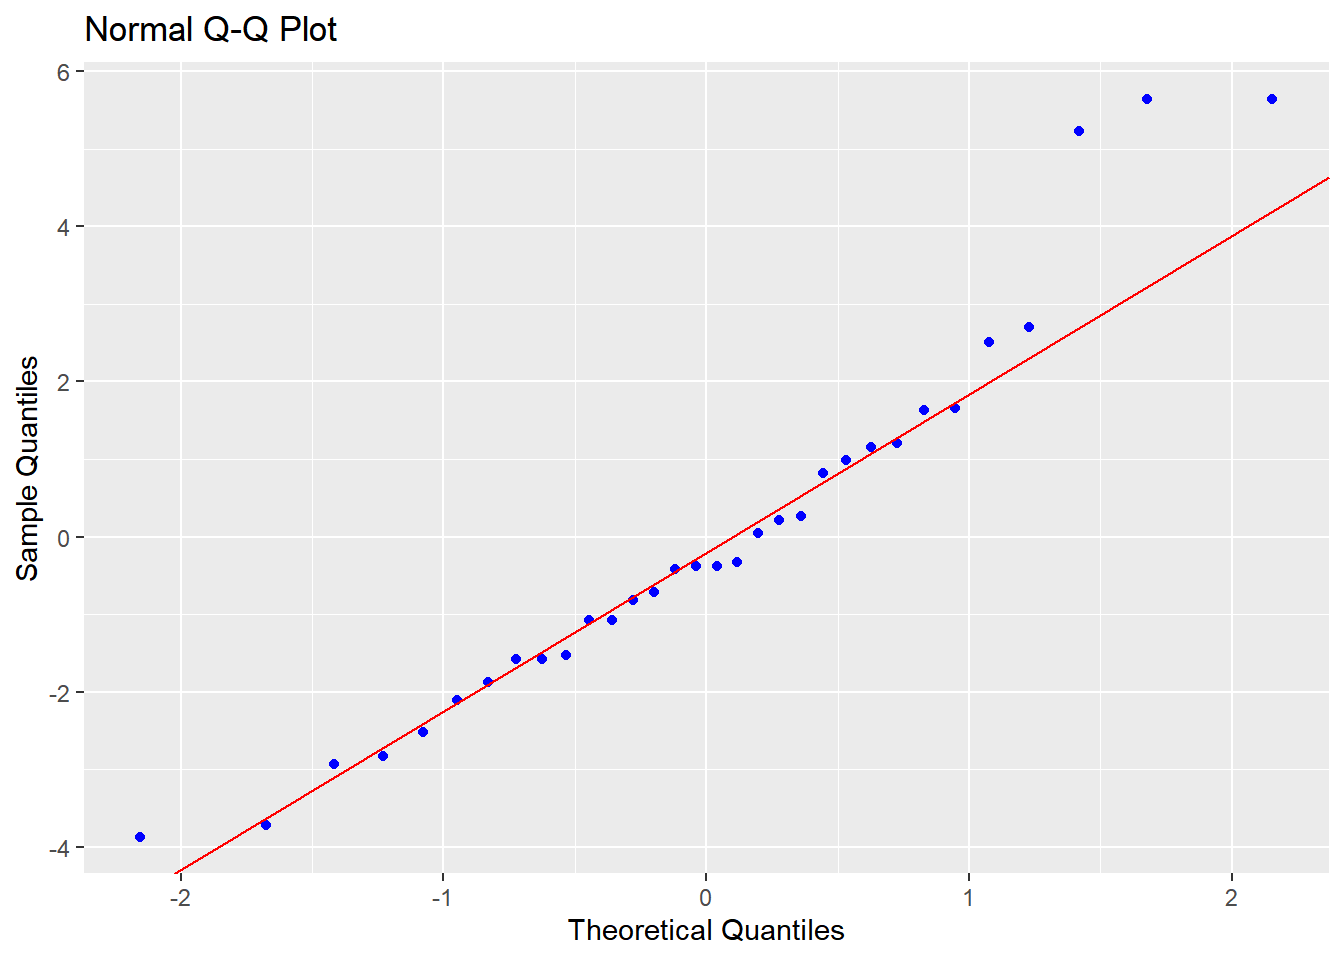
I am pleased to announce the olsrr package, a set of tools for improved output from linear regression models, designed keeping in mind beginner/intermediate R users. The package includes: comprehensive regression output variable selection procedures heteroskedasticiy, collinearity diagnostics and measures of influence various plots and underlying data If you ...
[Read more...]

ggplot2: Bar Plots

December 25, 2017 | Rsquared Academy Blog - Explore Discover Learn

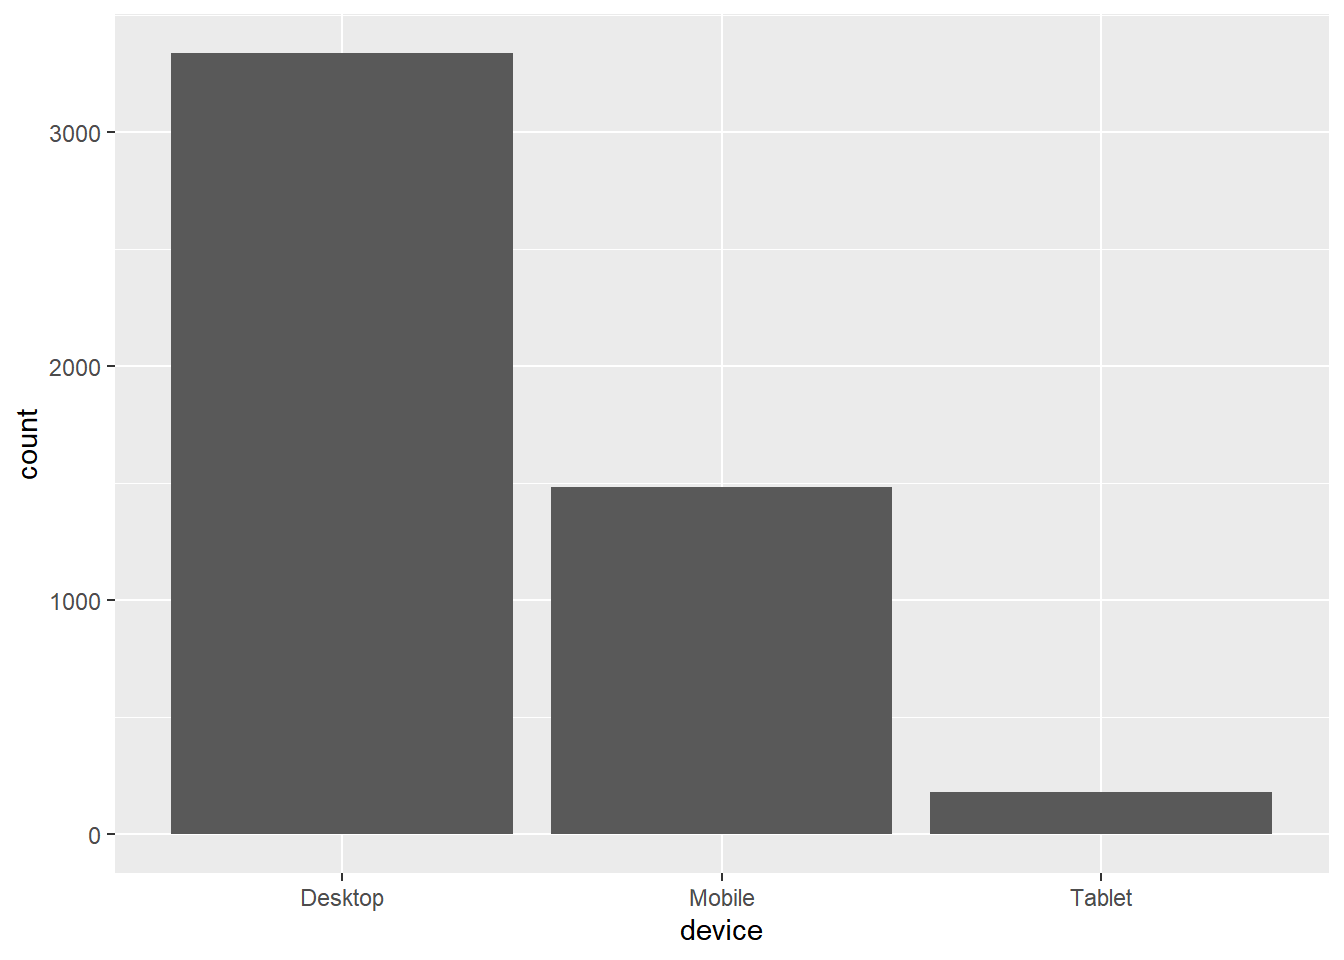
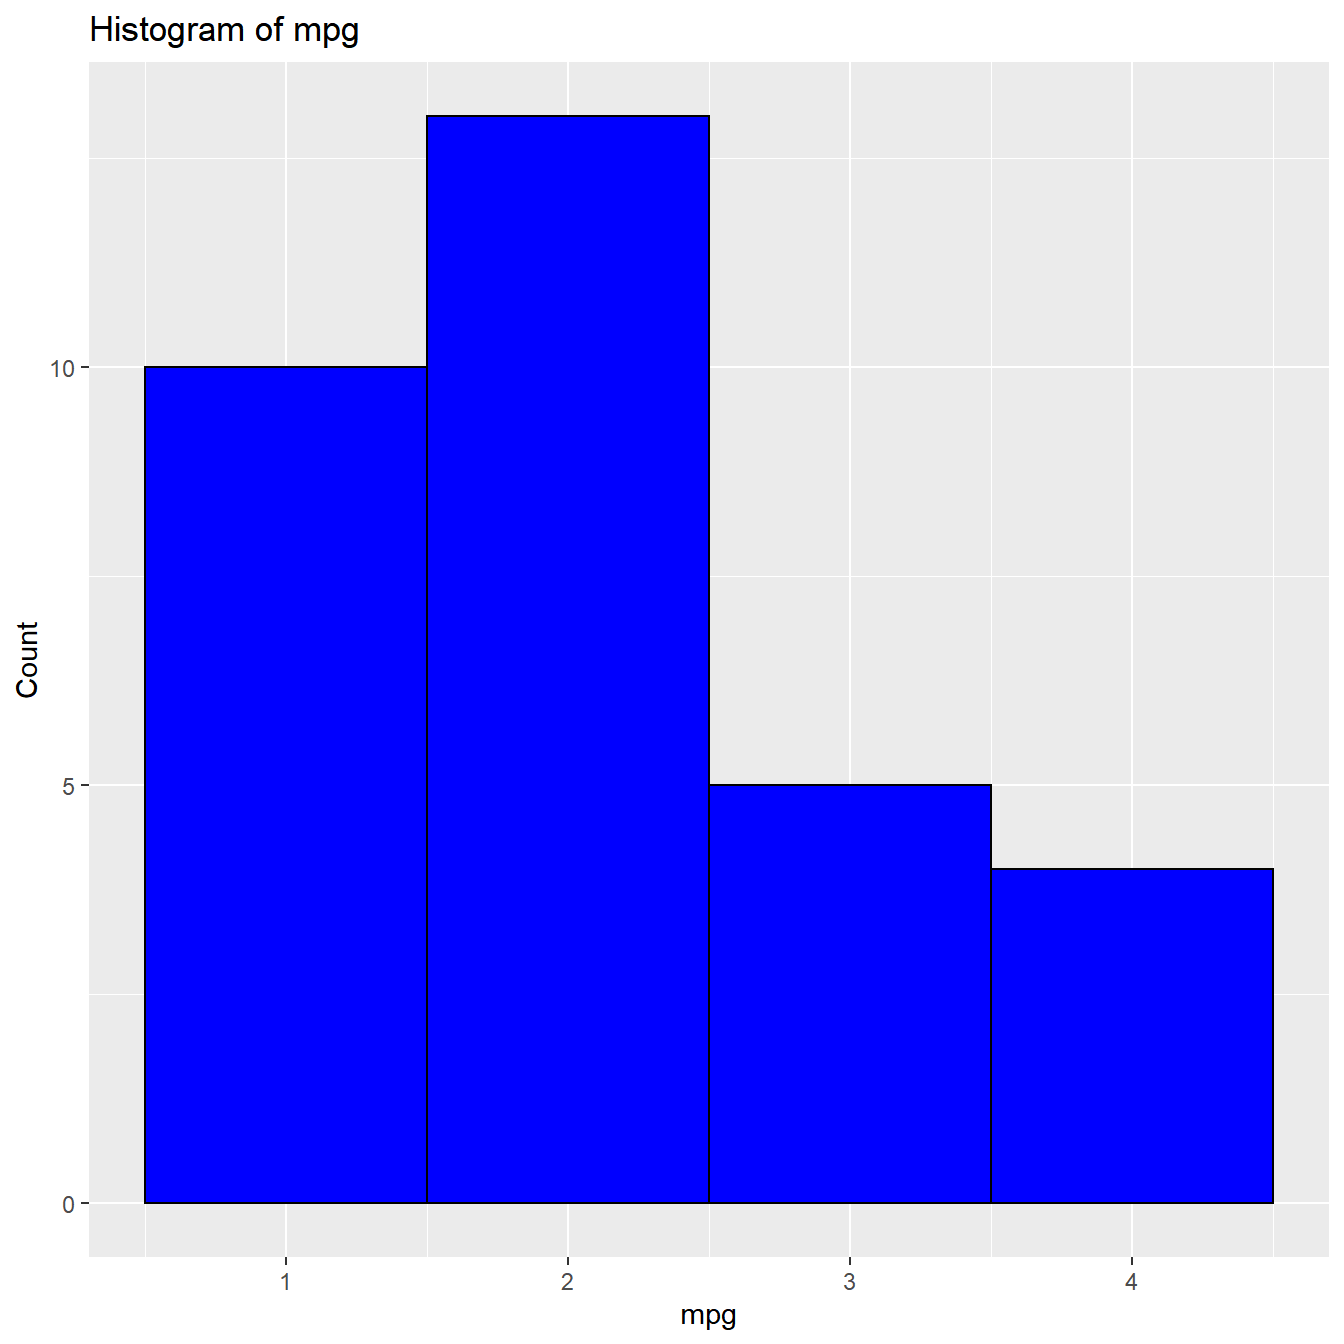
Introduction This is the ninth post in the series Elegant Data Visualization with ggplot2. In the previous post, we learnt to build line charts. In this post, we will learn to: build simple bar plot stacked bar plot grouped bar plot proportional bar plot map aesthetics to variables specify values ...
[Read more...]

ggplot2: Line Graphs

December 13, 2017 | Rsquared Academy Blog - Explore Discover Learn

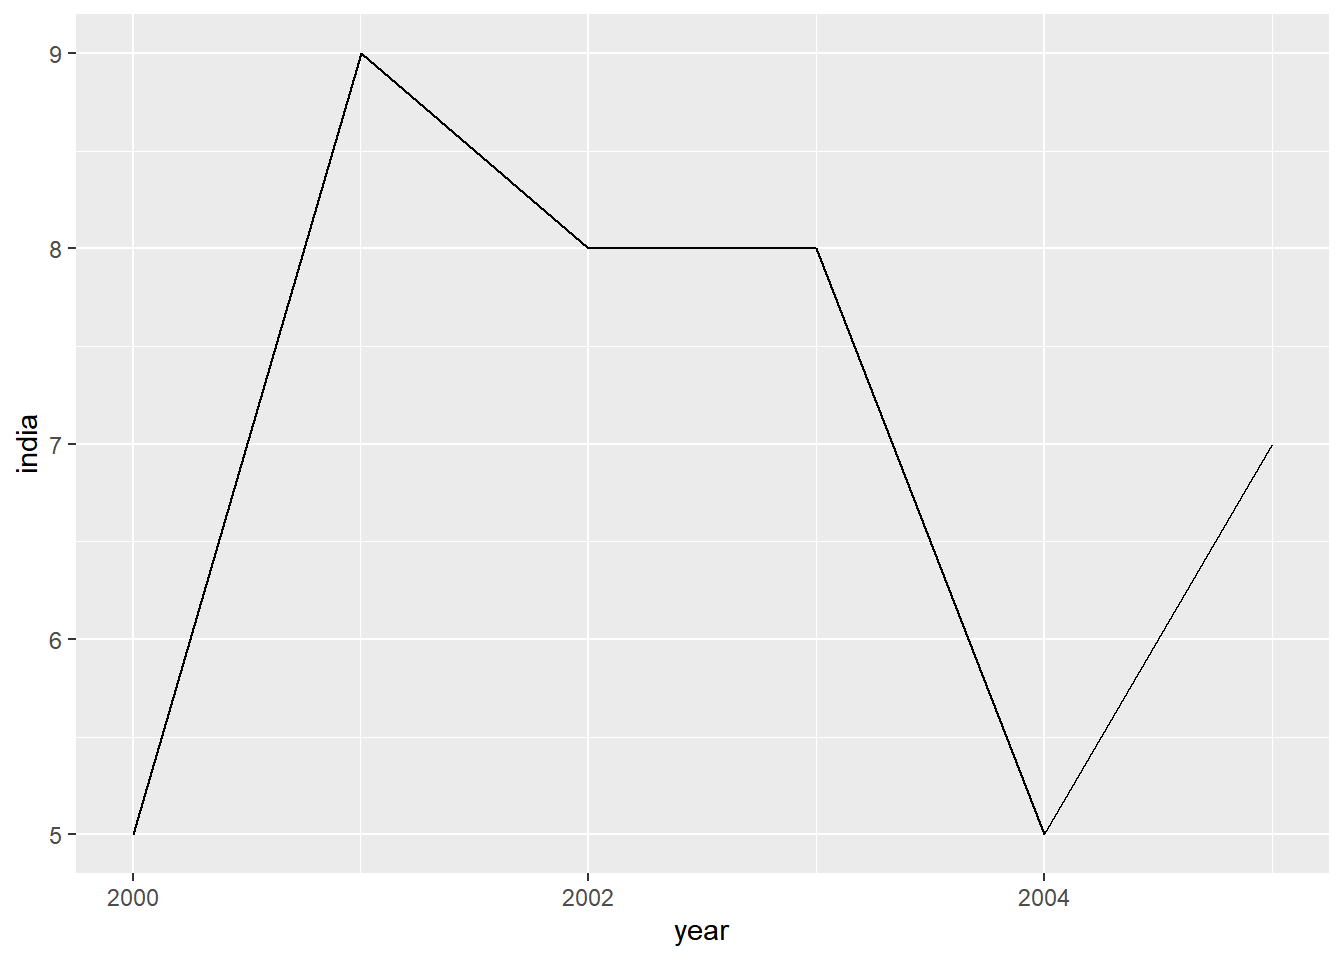
Introduction This is the 8th post in the series Elegant Data Visualization with ggplot2. In the previous post, we learnt to build scatter plots. In this post, we will learn to: build simple line chart grouped line chart map aesthetics to variables modify line color type size Libraries, Code & Data ...
[Read more...]
1 2

Never miss an update!
Subscribe to R-bloggers to receive
e-mails with the latest R posts.
(You will not see this message again.)

Click here to close (This popup will not appear again)