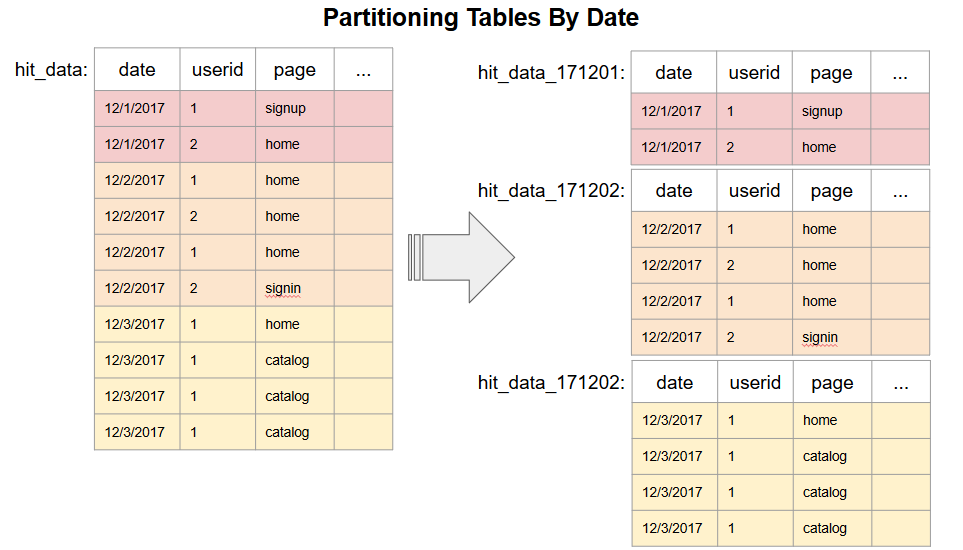
Articles by R Views

July 2017 New Package Picks

August 27, 2017 | R Views

Two hundred and twenty-four new packages were added to CRAN in July. Below are my picks for the “Top 40” packages arranged in eight categories: Machine Learning, Science, Statistics, Numerical Methods, Statistics, Time Series, Utilities and Visualizations. Science and Numerical Methods are categories that I have not used before. The idea ...
[Read more...]

Control Systems Toolbox – System Interconnection

August 23, 2017 | R Views

Introduction Dynamic systems are usually represented by a model before they can be analyzed computationally. These dynamic systems are systems that change, evolve or have their states altered or varied with time based on a set of defined rules. Dynamic systems could be mechanical, electrical, electronic, biological, sociological, and so ...
[Read more...]

Learning things we already know about stocks

August 21, 2017 | R Views

This example groups stocks together in a network that highlights associations within and between the groups using only historical price data. The result is far from ground-breaking; you can already guess the output. For the most part, the stocks get grouped together into pretty obvious business sectors. Despite the obvious ...
[Read more...]

Chapman University DataFest Highlights

August 17, 2017 | R Views

Editor’s Note: The 2017 Chapman University DataFest was held during the weekend of April 21-23. The 2018 DataFest will be held during the weekend of April 27-29. DataFest was founded by Rob Gould in 2011 at UCLA with 40 students. In just seven years, it has grown to 31 sites in three countries. Have ...
[Read more...]

Visualizations with R and Databases

August 15, 2017 | R Views

The Challenge Visualizations are one of R’s strengths. There are many functions and packages that create complex plots, often with one simple command. These plotting functions do two things: first, they take the raw data and run the calculations needed for a given visualization, and second, they draw the ...
[Read more...]

End-to-end visualization using ggplot2

August 13, 2017 | R Views

ggplot2 is kind of a household word for R users. I’ve ended up using it for complex data munging and wrangling work, where I needed to get clarity on different aspects of the data, especially being able to get different views, slices and dices of it, but in a ...
[Read more...]

Portfolio Volatility Shiny App

August 8, 2017 | R Views

In our 3 previous posts, we walked through how to calculate portfolio volatility, then how to calculate rolling volatility, and then how to visualize rolling volatility. Today, we will wrap all of that work into a Shiny app that allows a user to construct his or her own five-asset portfolio, choose ... [Read more...]

R and Interactive Graphics

August 6, 2017 | R Views

Judging from the number of JSM talks that incorporated interactive visualizations of some sort or another, it appears that interactive graphics have captured the attention of a good many statisticians. I found this a little surprising. Statisticians, on the whole, are not easily impressed by “eye candy”, and I believe ...
[Read more...]

A Postcard from JSM

August 1, 2017 | R Views

Baltimore has the reputation of being a tough town: hot in the summer and gritty, but the convention center hosting the Joint Statistical Meetings is a pretty cool place to be. There are thousands of people here and so many sessions (over 600) that it’s just impossible to get an ...
[Read more...]

Looking for R at JSM

July 27, 2017 | R Views

I am very much looking forward to attending JSM which begins this Sunday. And once again, I will be spending a good bit of my time hunting for new and interesting applications of R. In years gone by, this was a difficult game at JSM because R, R Package, Shiny, ... [Read more...]

June 2017 New Package Picks

July 25, 2017 | R Views

Two hundred and thirty-eight new packages were added to CRAN in June. Below are my picks for the “Top 40”, organized into six categories: Biostatistics, Data, Machine Learning, Miscellaneous, Statistics and Utilities. Some packages, including geofacet and secret, already seem to be gaining traction. Biostatistics BIGL v1.0.1: Implements response surface methods ...
[Read more...]

Visualizing Portfolio Volatility

July 20, 2017 | R Views

This is the third post in our series on portfolio volatility, variance and standard deviation. If you want to start at the beginning with calculating portfolio volatility, have a look at the first post here - Intro to Volatility. The second post on calculating rolling standard deviations is here: Intro ... [Read more...]

Some Ideas for your Internal R Package

July 18, 2017 | R Views

At RStudio, I have the pleasure of interacting with data science teams around the world. Many of these teams are led by R users stepping into the role of analytic admins. These users are responsible for supporting and growing the R user base in their organization and often lead internal ... [Read more...]

Introduction to Rolling Volatility

July 17, 2017 | R Views

This is the second post in our series on portfolio volatility, variance and standard deviation. If you missed the first post and want to start at the beginning with calculating portfolio volatility, have a look here - Introduction to Volatility. We will use three objects created in that previous post, ... [Read more...]

The R Survey

July 12, 2017 | R Views

The R Consortium is undertaking a multi-year effort to survey the whole R world. In a rather low-key blog post at the end of last month, the R Consortium’s technical committee, the Infrastructure Steering Committee (ISC), launched its prototype survey of R users. The idea is to use the ...
[Read more...]

Introduction to Volatility

July 11, 2017 | R Views

This is the beginning of a series on portfolio volatility, variance, and standard deviation. I realize that it’s a lot more fun to fantasize about analyzing stock returns, which is why television shows and websites constantly update the daily market returns and give them snazzy green and red colors. ... [Read more...]

Control Systems Toolbox in R – a GSoC 2017 Project

July 5, 2017 | R Views

Introduction Control theory is an interdisciplinary branch of mathematics and engineering that has the objective of controlling physical systems. A control system is a device or a collection of devices that manage, command, direct or regulate the behavior of other devices or systems. Control systems engineering is a major application ...
[Read more...]

Printing From Flex Dashboard

June 27, 2017 | R Views

Shiny applications of all stripes (including flexdashboard with runtime Shiny) are revolutionary in that they put the power of R directly in the end user’s hands without needing to interact directly with the language. A common way end-users wish to interact with their data is via a dashboard that ...
[Read more...]

May New Package Picks

June 22, 2017 | R Views

Two hundred and twenty-nine new packages were submitted to CRAN in May. Here are my picks for the “Top 40”, organized into five categories: Data, Data Science and Machine Learning, Education, Miscellaneous, Statistics and Utilities. Data angstroms v0.0.1: Provides helper functions for working with Regional Ocean Modeling System (ROMS) output. bikedata ...
[Read more...]

Analytics Administration for R

June 20, 2017 | R Views

Analytic administrator is a role that data scientists assume when they onboard new tools, deploy solutions, support existing standards, or train other data scientists. It is a role that works closely with IT to maintain, upgrade, and scale analytic environments. Analytic admins have a multiplier effect - as they go ...
[Read more...]
1 12 13 14 15 16 17

Never miss an update!
Subscribe to R-bloggers to receive
e-mails with the latest R posts.
(You will not see this message again.)

Click here to close (This popup will not appear again)