Articles by Quantargo Blog

Quantargo Workspace Now Out of Beta

September 28, 2021 | Quantargo Blog

Quantargo Workspace Now Out of Beta We’re thrilled to announce that Quantargo Workspace is now out of Beta and generally available! Quantargo Workspace lets you easily create and manage data science projects using R and Python, with advanced features ...
[Read more...]

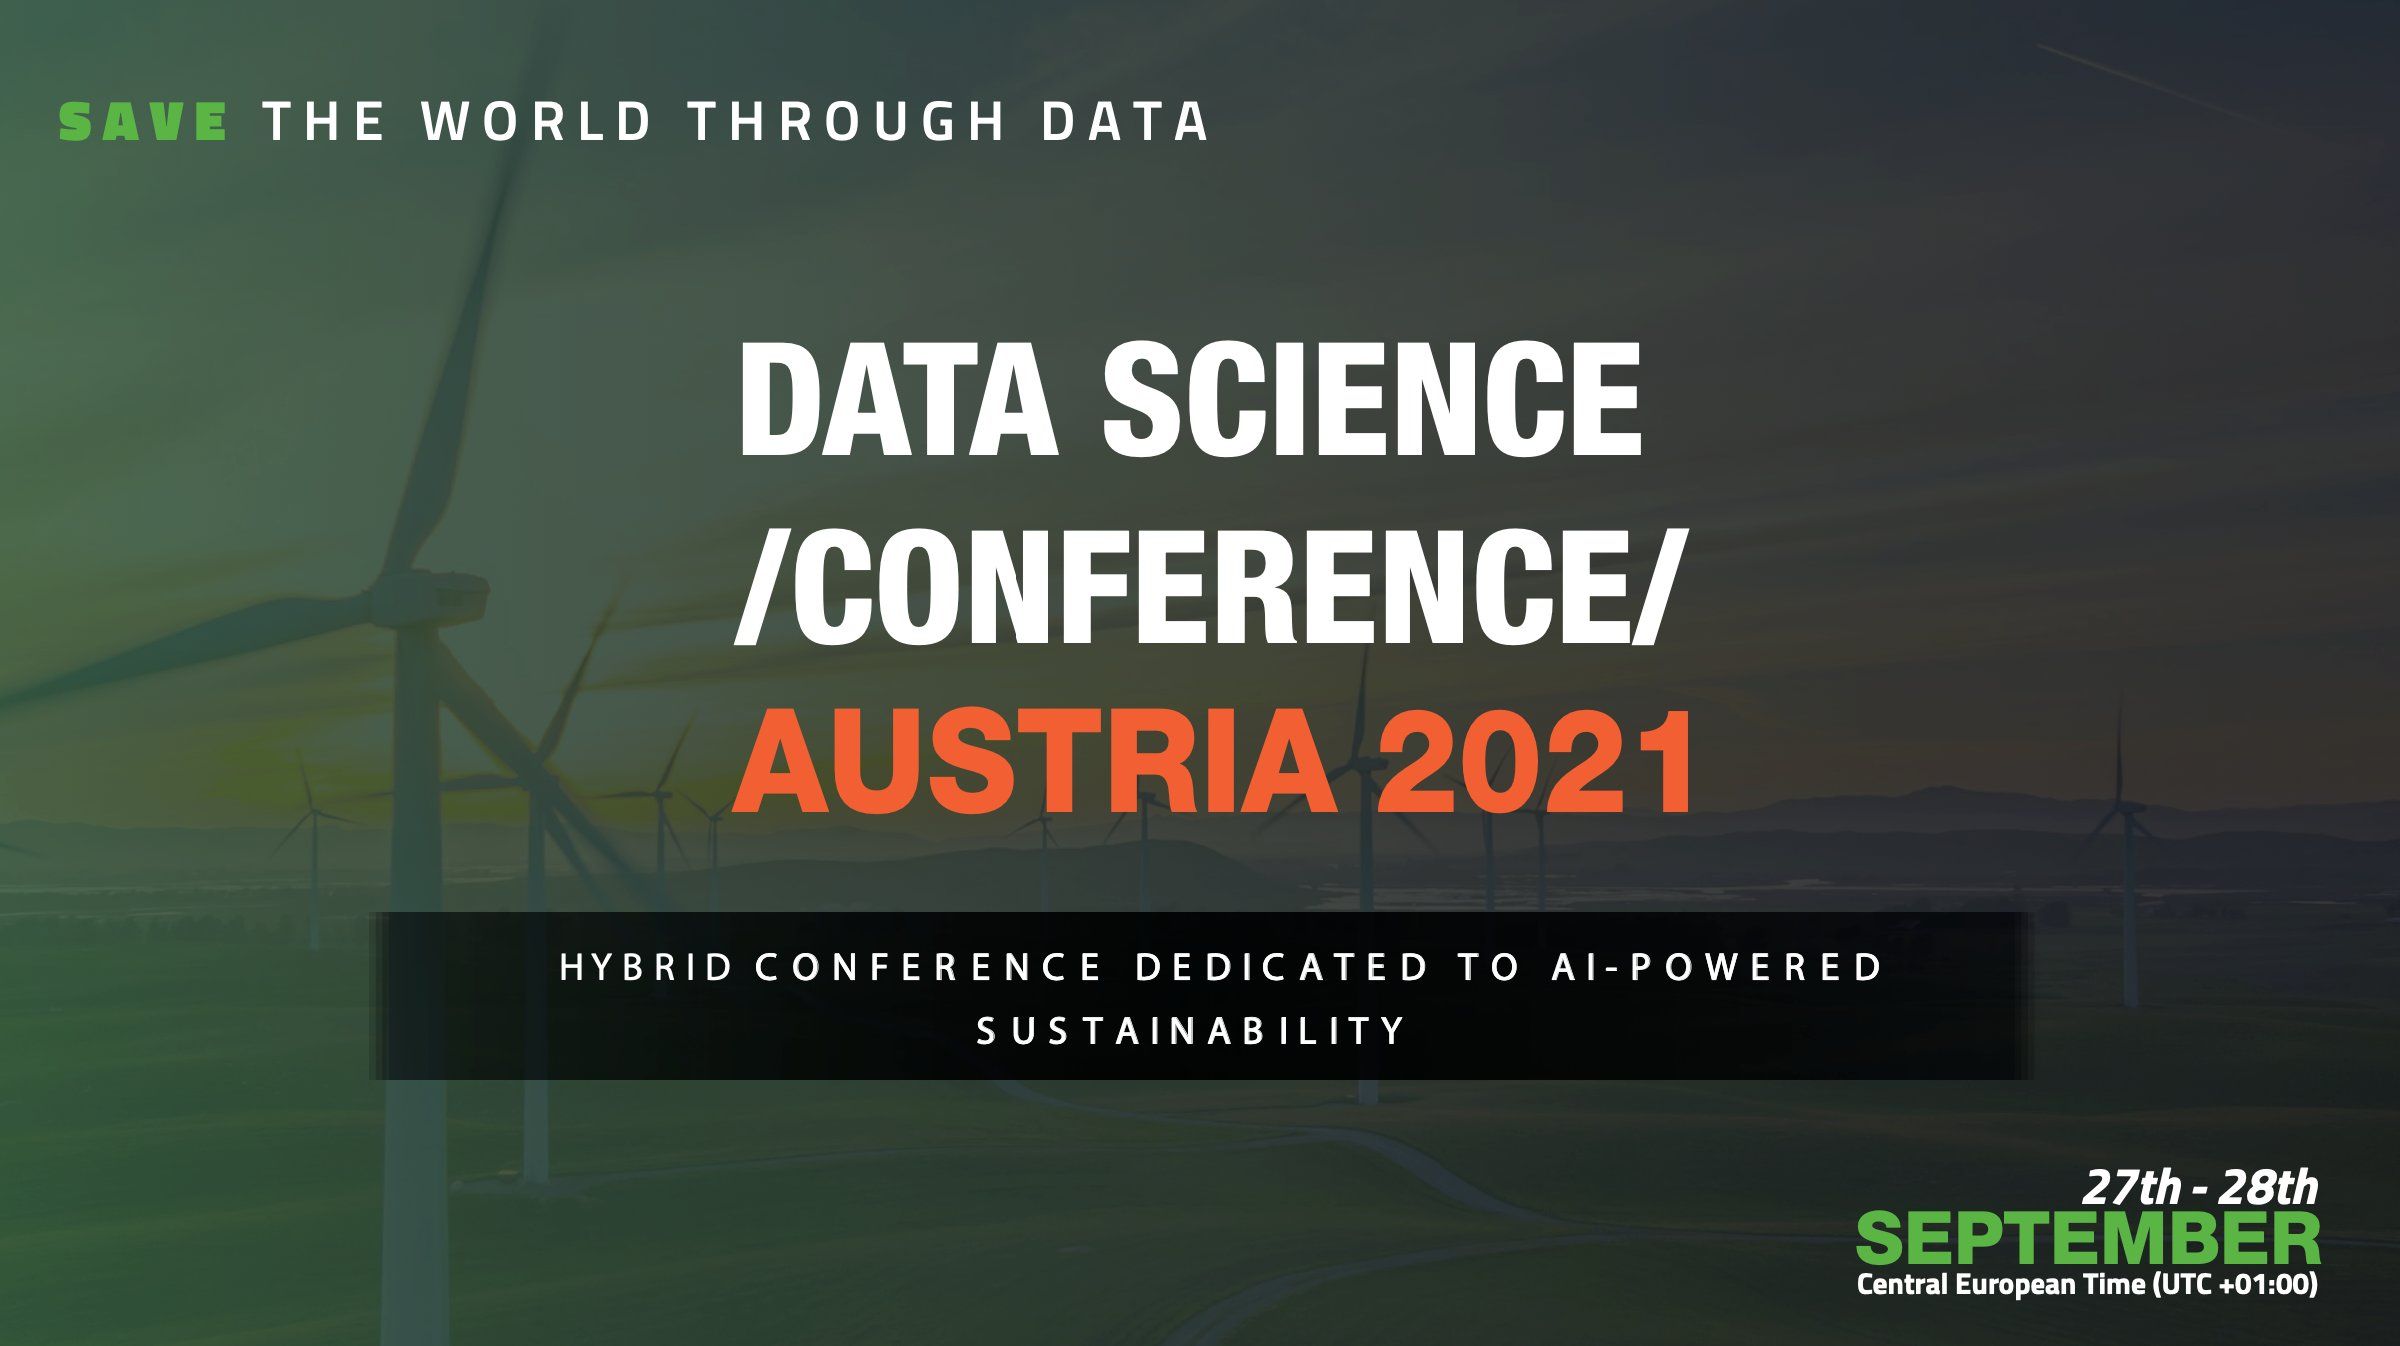
Data Science Conference Austria 2021

September 23, 2021 | Quantargo Blog

Data Science Conference Austria 2021 Data Science Conference (DSC) Austria is knocking on YOUR door, this time the theme is AI powered sustainability: Save the world through data! And the best is—we still have free tickets until Sept 25, so be quick! ...
[Read more...]

The Elon Musk Tweet Effect on Dogecoin (DOGE)

July 16, 2021 | Quantargo Blog

The Elon Musk Tweet Effect on Dogecoin (DOGE) Unveil the Dogefather Elon Musk is known for his regular tweets about many different topics—in particular his companies Tesla and SpaceX. With close to 60 million followers he truly is a Twitter celebrity and his opinions have a big impact on technologies ...
[Read more...]

Create Your Personal Cheat Sheets

March 25, 2021 | Quantargo Blog

Create Your Personal Cheat Sheets Cheat Sheets are a handy way to have the most important facts right at your fingertips. Especially when learning new concepts or a whole programming language, cheat sheets can help to stay on top of all the new things...
[Read more...]

Inspecting Data Structures

March 17, 2021 | Quantargo Blog

The first step of any data related task is to inspect the data we are dealing with. This is crucial for data wrangling as well, since we need to explore the current structure of the data, in order to identify the required transformations. Inspect tab...
[Read more...]

The 3 Doors of Data Transformation

March 4, 2021 | Quantargo Blog

This course covers the three most popular package ecosystems for data transformation in R: base R, tidyverse and data.table. You will see which options are better suited for specific use cases in terms of stability, features, speed and consistency. G...
[Read more...]

Create a line graph with ggplot

September 5, 2020 | Quantargo Blog

Use the geom_line() aesthetic to draw line graphs and customize its styling using the color parameter. Specify which coordinates to use for each line with the group parameter. Create your first line graph using geom_line() Define how different lines are connected using the group parameter Change the line ...
[Read more...]

Data Science Conference Austria 2020

September 4, 2020 | Quantargo Blog

Data Science Conference Austria 2020 Data Science Conference (DSC) Austria is knocking on YOUR door - and it is all for free! ???????????? DSC Austria will happen on September 8-9th and during the event, you will get a chance to listen to over 15 high-quality ...
[Read more...]

Specify additional aesthetics for points

July 28, 2020 | Quantargo Blog

ggplot2 implements the grammar of graphics to map attributes from a data set to plot features through aesthetics. This framework can be used to adjust the point size, color and transparency alpha of points in a scatter plot. Add additional plotting d...
[Read more...]

Create a scatter plot with ggplot

July 22, 2020 | Quantargo Blog

Make your first steps with the ggplot2 package to create a scatter plot. Use the grammar-of-graphics to map data set attributes to your plot and connect different layers using the + operator. Define a dataset for the plot using the ggplot() function ...
[Read more...]

Why data visualization is important

July 15, 2020 | Quantargo Blog

Data visualization is not only important to communicate results but also a powerful technique for exploratory data analysis. Each plot type like scatter plots, line graphs, bar charts and histograms has its own purpose and can be leveraged in a powerf...
[Read more...]
1 2 3

Never miss an update!
Subscribe to R-bloggers to receive
e-mails with the latest R posts.
(You will not see this message again.)

Click here to close (This popup will not appear again)