Articles by markheckmann

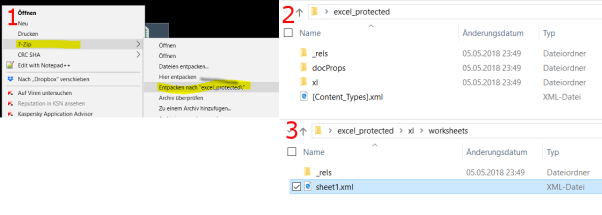
Remove password protection from Excel sheets using R

May 5, 2018 | markheckmann

Most data scientists wished that all data lived neatly managed in some DB. However, in reality, Excel files are ubiquitous and often a common way to disseminate results or data within many companies. Every now and then I found myself in the situation where I wanted to protect Excel sheets ...
[Read more...]

QQ-plots in R vs. SPSS – A look at the differences

December 15, 2014 | markheckmann

We teach two software packages, R and SPSS, in Quantitative Methods 101 for psychology freshman at Bremen University (Germany). Sometimes confusion arises, when the software packages produce different results. This may be due to specifics in the implemention of a method or, as in most cases, to different default settings. One ...
[Read more...]

Using colorized PNG pictograms in R base plots

September 12, 2014 | markheckmann

Today I stumbled across a figure in an explanation on multiple factor analysis which contained pictograms.   Figure 1 from Abdi & Valentin (2007), p. 8. I wanted to reproduce a similar figure in R using pictograms and additionally color them e.g. by group membership . I have almost no knowledge about image processing, so […] [Read more...]

Useful R snippets

March 18, 2012 | markheckmann

In this post we collect several R one- or few-liners that we consider useful. As our minds tend to forget these little fragments we jot them down here so we will find them again. Indexing in nested loops Every once in a while I run a nested loop like the ... [Read more...]

multi-platform real-time ‘intro’ in R using rdyncall

July 29, 2011 | markheckmann

Guest post by Daniel Adler. Below is a real-time audio-visual multimedia demonstration – or in short ‘an intro’ – written in 100% pure R. It requires no compilation and runs across major platforms via the package rdyncall and preinstalled precompiled standard libraries such as OpenGL and SDL libraries. This ‘happy-birthday’ production runs about 3 ... [Read more...]

Using R, Sweave and Latex to integrate animations into PDFs

April 18, 2011 | markheckmann

The first week of April I attended an excellent workshop on biplots held by Michael Greenacre and Oleg Nenadić at the Gesis Institute in Cologne, Germany. Throughout his presentations, Michael used animations to visualize the concepts he was explaining. He also included  animations in some of his papers. This inspired ... [Read more...]

Animate .gif images in R / ImageMagick

November 21, 2010 | markheckmann

Yesterday I surfed the web looking for 3D wireframe examples to explain linear models in class. I stumbled across this site where animated 3D wireframe plots are outputted by SAS.  Below I did something similar in R. This post shows the few steps of how to create an animated .gif ... [Read more...]

How accurate or reliable are R calculations?

March 28, 2009 | markheckmann

On the REvolutions Blog there is a nice posting treating the often raised concern on “How good or reliable R is”. At my university R is hardly used. Sometimes I was asked by lecturers wether the calculations done by R and its packages are accurate. The linked posting treats this ... [Read more...]

R: Good practice – adding footnotes to graphics

February 17, 2009 | markheckmann

In some statistical programs there is the option available to attach a footnote to the graphical output that is created. This footnote may contain the name of the script or the file that produced the graphic, the author’s name and the date of creation. In SAS for example there ... [Read more...]
1 2

Never miss an update!
Subscribe to R-bloggers to receive
e-mails with the latest R posts.
(You will not see this message again.)

Click here to close (This popup will not appear again)