Articles by Gregory Kanevsky

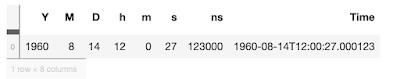
Time Travel with py datatable 1.0

July 19, 2021 | Gregory Kanevsky

R package data.table has become a tool of choice when working with big tabular data thanks to its versatility and performance. Its Python counterpart py datatable follows R cousin in performance and steadily catches up in functionality. A notable omiss...
[Read more...]

Survey Results: What Degree is Best for Data Science?

March 17, 2020 | Gregory Kanevsky

The Survey The survey What Degree is Best for Data Science? ran from  February 9 through March 12, 2020 asking participants 4 questions: Answers about self: Q1: What is the highest level of school degree you have completed? Q2: Which of the following best describes the field in which you received your highest degree?  ...
[Read more...]

Survey: What Degree is Best for Data Science?

February 21, 2020 | Gregory Kanevsky

  TL;DRJust answer 4 questions about best degree for Data Science here: https://www.surveymonkey.com/r/7FGGWS7 No doubt asking the question "What's the best degree for Data Science?" one won't expect unified or even a few opinions (unless everything I know about people practicing data science is all wrong). ...
[Read more...]

How H2O propels data scientists ahead of itself: enhancing Driverless AI with advanced options, recipes and visualizations

December 14, 2019 | Gregory Kanevsky

H2O engineers continually innovate and implement latest techniques by following and adopting latest research, working on cutting edge use cases, and participating and winning machine learning competitions like Kaggle. But thanks to explosion of AI research and applications even most advanced automated machine learning platforms like H2O.ai ...
[Read more...]

The Role of Small Data and Vacation Recap Example

July 5, 2017 | Gregory Kanevsky

Wikipedia defines small data 'small' enough for human comprehension but then it goes further by qualifying data in a volume and format that makes it accessible, informative and actionable. I am not certain the latter is always true: smaller footprint doesn't automatically qualify data as informative and actionable without more ...
[Read more...]

Logarithmic Scale Explained with U.S. Trade Balance

June 23, 2017 | Gregory Kanevsky

Skewed data prevail in real life. Unless you observe trivial or near constant processes data is skewed one way or another due to outliers, long tails, errors or something else. Such effects create problems in visualizations when a few data elements are much larger than the rest. Consider U.S. 2016 ...
[Read more...]

MapReduce in Two Modern Paintings

May 25, 2017 | Gregory Kanevsky

Two years ago we had a rare family outing to the Dallas Museum of Art (my son is teenager and he's into sport after all). It had an excellent exhibition of modern art and DMA allowed taking pictures. Two hours and dozen of pictures later my weekend was over but ...
[Read more...]

Correlation Primer with Aster and R

December 20, 2016 | Gregory Kanevsky

Calculating correlations is often starting point before more advanced analytical steps take place. Big data (long data) always presents computational challenges of both scale and distributed nature. In turn they may get aggravated by the presence of large number of features (wide data). But challenges do not stop here as ... [Read more...]

Map of the Windows Fonts Registered with R

April 24, 2016 | Gregory Kanevsky

If you already found package extrafont then you probably found how to load and use Windows fonts in R visualizations. But just in case, everything to get started with extrafont is found here and summarized for using fonts in Windows for on-screen or bitmap output below:One thing to add ...
[Read more...]

Creating and Tweaking Bubble Chart with ggplot2

April 16, 2016 | Gregory Kanevsky

This article will take us step-by-step over incremental changes to produce a bubble chart using ggplot2 that looks like this:We'll encounter the plot above once again at the very end after explaining each step with code changes and observing intermediate plots. Without getting into details what it means (curios ...
[Read more...]

R Graph Objects: igraph vs. network

January 30, 2016 | Gregory Kanevsky

While working on new graph functions for my package toaster I had to pick from the R packages that represent graphs. The choice was between network and graph objects from the network and igraph correspondingly - the two most prominent packages for creating and manipulating graphs and networks in R....
[Read more...]
1 2

Never miss an update!
Subscribe to R-bloggers to receive
e-mails with the latest R posts.
(You will not see this message again.)

Click here to close (This popup will not appear again)