Accessing global weather model data using the rNOMADS package in R
Want to share your content on R-bloggers? click here if you have a blog, or here if you don't.
The rNOMADS package interfaces with the NOAA Operational Model Archive and Distribution System to provide access to 55 operational (i.e. real time and prediction) models describing the state of the ocean and the atmosphere. rNOMADS has been used to get wind and wave data for a real time sailing game, to quantify solar energy available for power plants in Europe, and to predict helium balloon flights. We look forward to continuing to hear about novel and unexpected uses for this spectacular data set.
In this post, we show how to use rNOMADS to do the following:
1. Plot global temperature and wind at different atmospheric pressure levels
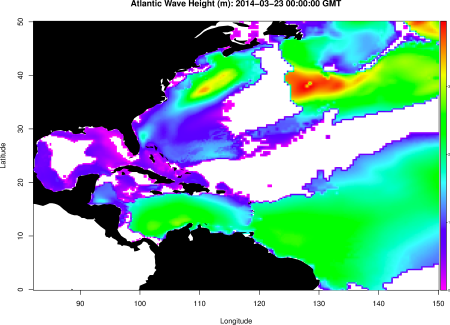
2. Examine the distribution of wave heights in the Atlantic ocean
3. Produce a precise atmospheric temperature and wind profile for a specific point at a specific time
4. Generate simultaneous atmospheric profiles at over 100 locations on the Eastern Seaboard of the USA
Links to source code are provided below each set of figures. A link to rNOMADS installation instructions is provided at the end of the post.
Global Temperature and Wind Maps
The Global Forecast System (GFS) model provides weather data on a 0.5 x 0.5 degree grid for the entire planet. It is run 4 times daily, and produces a prediction every three hours out to 180 hours. The zero hour “analysis” forecast is the state of the atmosphere at the model run time, and it uses some observational data to increase its accuracy. Here, we plot the temperature at 2 m above the surface, the wind at 10 m above the surface, and the winds at 300 mb (around 9 kilometers elevation). The 300 mb plot often shows the northern and southern jet streams quite well.

Winds at the surface of the Earth from the GFS model. Note the little spot of high winds south of Indonesia – that’s Tropical Cyclone Gillian, a Category 3 storm when this image was generated.

Jet streams and Rossby waves are clearly visible in this image of the wind speeds of the upper troposphere/lower stratosphere.
Download the source code for these images here.
Wave Heights in the Atlantic Ocean
rNOMADS can also access the NOAA Wave Watch Model. While I’m less familiar with this one, I was able to generate a plot of what (I think) are wave heights in the western Atlantic Ocean and the Caribbean.
Download the source code for this image here.
Instantaneous Atmospheric Profile over Sakura-Jima volcano, Japan
It’s important to know which direction the winds are going directly above active volcanoes, because eruptions can carry ash into air space and over inhabited areas. One impetus for the continued development of rNOMADS was to provide a one-stop solution for generating high precision wind profiles over specific points, allowing ash distribution prediction as soon as an eruption begins. Here, we have generated a spatially and temporally interpolated wind and temperature profile over Sakura-Jima volcano, Japan. The profile is calculated for the exact time when the source code is run.

An eruption at this instant would produce ashfalls east of the volcano for a plume height of 15 km. However, if a truly massive 30 km high plume was produced, ashfalls would occur both east and west of the volcano.
Download the source code for these images here.
Wind and temperature profiles over the USArray seismic and infrasound network
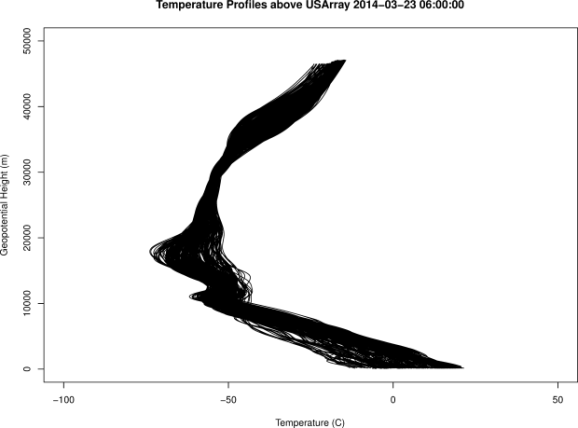
The USArray is a massive grid of seismic and infrasound (low frequency sound) sensors currently occupying the Eastern seaboard of the United States. Since infrasound propagation is strongly affected by temperature and wind, it’s important to know the weather conditions over each station. Here, we’ve plotted the temperature and wind profiles for every single station in the USArray on the same plot. The large variations in wind speed will result in very different infrasound propagation depending on where the stations are located.

Wind speed profiles over USArray stations. It appears that wind speeds vary by over 100 km/hr at certain heights between stations.
Download the source code for these images here.
Some of these scripts require the aqfig package in R to generate the colorbar legends.
Instructions on installing R, rNOMADS, and their dependencies are here.
R-bloggers.com offers daily e-mail updates about R news and tutorials about learning R and many other topics. Click here if you're looking to post or find an R/data-science job.
Want to share your content on R-bloggers? click here if you have a blog, or here if you don't.


