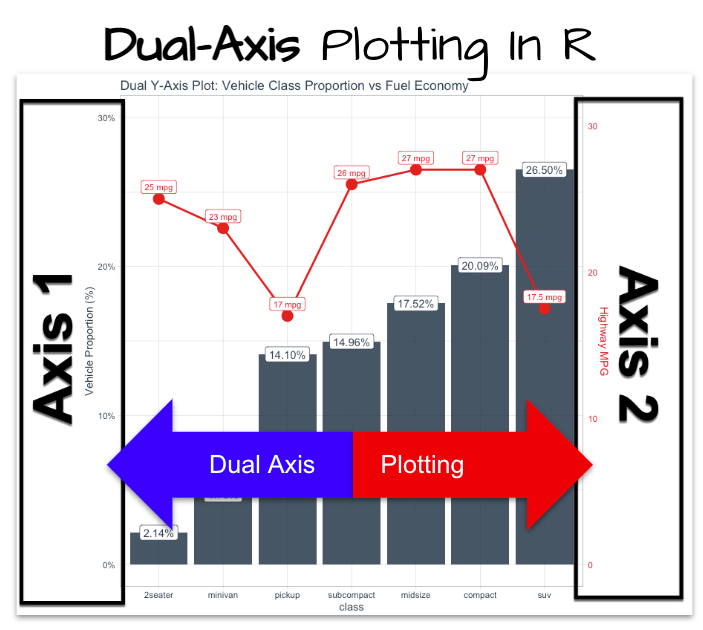
How to make a plot with two different y-axis in R with ggplot2? (a secret ggplot2 hack)
I can’t tell you how painful it is to be better at something in Excel than in R. And one of the gripes I still have (10 years after making the switch from Excel to R) is that it’s still tough to make dual-axis plots in R.
Guess what, ...

