June 2021

Working with Notion API from R

June 21, 2021 | Roman Luštrik

When searching for a solution where I could store some flat files as a database, Notion came up. The nice thing about it is that it offers an API to most of its functionality. At the time of this writing this is still in beta, but hopefully it will bec... [Read more...]

Tutorial: Build a Full Shiny Dashboard With shiny.fluent

June 20, 2021 | Appsilon

shiny.fluent – Taking Shiny Dashboards to New Heights With Appsilon’s recent public launch of two new R packages – shiny.fluent and shiny.react, the accessibility of React libraries to the Shiny dev community is now easier than ever. shiny.react opens up the rich React ecosystem (e.g., frameworks, ...
[Read more...]

Benchmark Bond Portfolio Returns using R code

June 20, 2021 | sang-heon lee

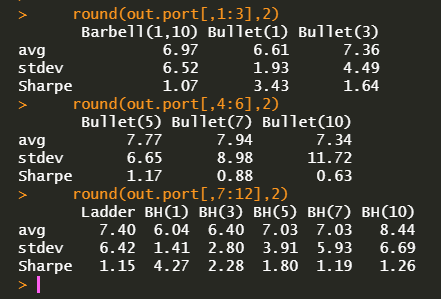
This post calculates the holding period returns of four benchmark zero coupon bonds portfolios such as bullet, barbell, ladder and buy-and-hold using R code Benchmark Bond Portfolio Strategies Bond portfolio strategies are too many to enumerate. But there are benchmark bond strategies which are frequently introduced to textbook. Among them ...
[Read more...]

Hierarchical forecasting of hospital admissions- ML approach (ensemble)

June 19, 2021 | R on notast

1. Recap 2 Tune again Modelling Retuning 2.1 Retune Random Forest 2.2 Retune Prophet boost 2.3 Performance (after retuning) 3 Ensemble 3.1 Peformance (ensemble) 4 Performance (individual levels) Hospital Cluster level National level 5 The future Hospital Cluster National 6 KIV Plans Errors 1. Recap The aim of this series of blog is to predict monthly admissions to Singapore public acute ...
[Read more...]

9 new R books added ???

June 18, 2021 | Oscar

This is the first time I’m writing up a blog post to summarise new books that have been added to Big Book Of R. I’ll keep doing so in future! A quick thank you to @LeganaFingerfut for adding R for Health Data Science, and to @RCoderWeb for adding ...
[Read more...]

Bubble Chart in R-ggplot & Plotly

June 18, 2021 | finnstats

Bubble Chart in R, A bubble chart is majorly used to show the relationships between numeric variables and it can visualize two to four dimensions. The first two... The post Bubble Chart in R-ggplot & Plotly appeared first on finnstats.
[Read more...]

Join Appsilon at useR! 2021 on July 5-9

June 17, 2021 | Appsilon

Are you ready to join Appsilon at a global-by-design virtual R conference? The useR! 2021 Conference is only 3 weeks away, and this year Appsilon is a Platinum Sponsor. In addition, our team members Marcin Dubel, Marek Rogala, and Maria Grycuk will be delivering non-sponsored talks on enterprise Shiny app development, Appsilon ...
[Read more...]

Yield to Maturity and Reinvestment Risk

June 17, 2021 | sang-heon lee

This post shows how the reinvestment risk affect the holding period return of coupon bond using R code Coupon Bond and Reinvestment Risk using R code At first, we need to make a distinction between par yield and YTM (Yield to Maturity). Par Yield The par yield is the coupon ...
[Read more...]

Data Science on Blockchain with R

June 17, 2021 | Thomas de Marchin

Part I: Reading the blockchainCryptoPunks are the earliest versions of NFTs (www.larvalabs.com/cryptopunks). Image modified from https://commons.wikimedia.org/wiki/File:Cryptopunks.png.By Thomas de Marchin (Senior Manager Statistics and Data Sciences at Pharmalex) and Milana Filatenkova (Manager Statistics and Data Sciences at Pharmalex)IntroductionWhat is ...
[Read more...]
1 2 3 4 5 6 10

Never miss an update!
Subscribe to R-bloggers to receive
e-mails with the latest R posts.
(You will not see this message again.)

Click here to close (This popup will not appear again)