
WPA – Bowler Review
Want to share your content on R-bloggers? click here if you have a blog, or here if you don't.
Hello readers, and today is the next in m series of reviewing the WPA metric and what it can show. If this is the first one you are reading then go catch the other two linked here
Win Probability Added – Batsman Review
Twenty20 Win Probability Added
The first blog covers the building of the model the second looks at reviewing batsman performances. Today though I’m going to be looking at reviewing bowlers.
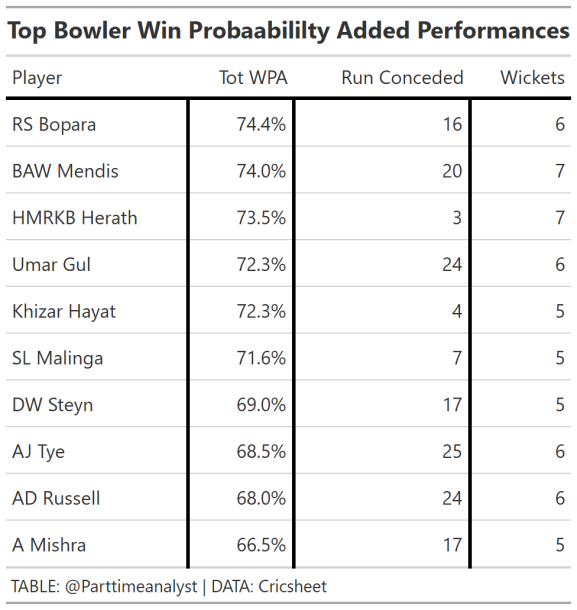
Above you can see the best 10 performances in the data I have for win probability added. All of them include multiple wickets where as runs conceded some are super low and some at around average. There’s no bowler appearing twice but these bowlers have added a similar amount to the batsman in the top 10. Heraths 3-7 spell must have been incredible to watch.

Clearly the more wickets a bowler takes the more contribution they have to their teams chances of winning the match. There is a significant rise form when a bowler takes 0 wickets they hardly ever have a positive impact on there teams to if they take 3 or more wickets they nearly always have a positive impact.
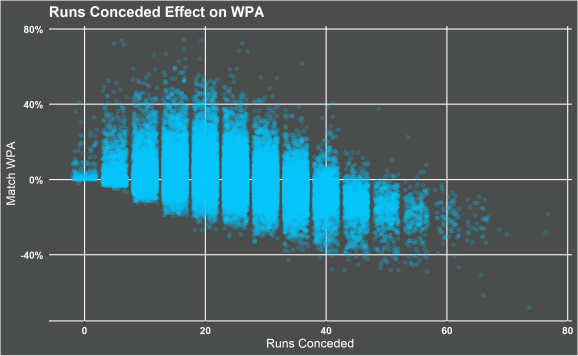
Runs conceded there is some downward trend with a worse impact the more runs conceded but it doesn’t seem to be as clear cut as the wickets taken. Is this a hint that taking wickets is more important then runs conceded?

This distribution of the Win probability added per 10 balls for all bowlers in this years vitality blast and IPL illustrates how difficult the IPL is. There are more players operating in the positive region in the Vitality Blast compared to the IPL and more players operating in the strong negative region in the IPL though the majority of players are around the same level in both competitions.

There’s no point in a metric if it has no predictive power or tell you how a player might do. For the plot above I took a bowlers WPA in the vitality blast for all the previous season. I then compared it to the latest 2020 season. There is a trend in the numbers so there is some predictive power. Obviously no metric is going to be perfect because there is so much variability in player performance.

Ben Stokes is not the best twenty20 bowler. I guess that should be expected he’s an all rounder. His latest season in the IPL of bowling was simply awful with on average each over costing his team -3% win probability. Maybe his last two seasons have been affected by injury but if you compare his 2020 international performance that seems at a level he has historically performed.

Finally looking at one of the best twenty20 fast bowlers in the world Jasprit Bumrah. Clearly in his IPL performances he has a positive trajectory has he’s got older and more experienced. There’s obviously a lot of different players that could be looked at so in the future blog I will be detailing building a shiny dashboard to search players and look at games. Also a further blog with look at age effects and type of bowler effects.
R-bloggers.com offers daily e-mail updates about R news and tutorials about learning R and many other topics. Click here if you're looking to post or find an R/data-science job.
Want to share your content on R-bloggers? click here if you have a blog, or here if you don't.