April 2020

Proofs without Words using gganimate

April 25, 2020 | R on Notes of a Dabbler

I recently watched the 2 part workshop (part 1, part 2) on ggplot2 and extensions given by Thomas Lin Pedersen. First of, it was really nice of Thomas to give the close to 4 hour workshop for the benefit of the community. I personally learnt a lot from it. I wanted to try out ... [Read more...]

Visualizing Multilevel Networks with graphlayouts

April 25, 2020 | schochastics

This post introduces layout_as_multilevel(), a new function in the {{graphlayouts}} package. As the name suggests, this function can be use to visualize multilevel networks. A multilevel network consists of two (or more) levels with different node sets and intra-level ties. For instance, one level could be scientists and ... [Read more...]

WrightMap Tutorial 5

April 25, 2020 | R on WrightMap

More Flexibility using the person and item side functions Introduction Version 1.2 of the WrightMap package allows you to directly access the functions used for drawing the person and item sides of the map in order to allow more flexible item person maps. The parts can be put together on the ...
[Read more...]

Riddler: Can You Solve The Chess Mystery?

April 25, 2020 | Posts | Joshua Cook

Summary The Riddler is a weekly puzzle provided by FiveThirtyEight. This week’s puzzle involves finding the path used by the knight to kill the opposing queen in a game of chess. Below, I show how I solved puzzle using two methods: a siumulation of the chessboard and by building ...
[Read more...]

Intron Characteristics from GFF

April 25, 2020 | morphoscape

To calculate min, median, mean, and max intron lengths from a gff file use the intronsByTranscript function of GenomicFeatures in R. Be sure to first use the makeTxDbFromGFF function of GenomicFeatures to create a TxDb object of th...
[Read more...]

WrightMap Tutorial 4

April 25, 2020 | R on WrightMap

Using Conquest Output and Making Thresholds Updated Fri 24-Apr-2020 Intro In this part of the tutorial, we’ll show how to load ConQuest output to make a CQmodel object and then WrightMaps. We’ll also show how to turn deltas into thresholds. All the example files here are available in ...
[Read more...]

V is for Verbs

April 25, 2020 | Unknown

In this series, I've covered five terms for data manipulation:arrangefiltermutateselectsummariseThese are the verbs that make up the grammar of data manipulation. They all work with group_by to perform these functions groupwise.There are scoped version...
[Read more...]

WrightMap Tutorial 3

April 24, 2020 | R on WrightMap

Plotting Multidimensional & Polytomous Models Updated Fri 24-Apr-2020 Multidimensional models We will need again to load RColorBrewer for this example. install.packages("RColorBrewer") library(RColorBrewer) We start by creating mock person and item estimates. For the person proficiencies we create a matrix with five columns of 1000 values each. set.seed(2020) mdim....
[Read more...]

WrightMap Tutorial 2

April 24, 2020 | R on WrightMap

Plotting the items in different ways Updated Fri 24-Apr-2020 Setup We start by creating mock person and item estimates. For the person proficiencies we create a single vector with 1000 values. set.seed(2020) mdim.sim.thetas
[Read more...]

Bayesian linear regression

April 24, 2020 | Modeling with R

Introduction Data preparation Classical linear regression model Bayesian regression Bayesian inferences PD and P-value Introduction For statistical inferences we have tow general approaches or frameworks: Frequentist approach in which the data sampled from the population is considered as random and the population parameter values, known as null hypothesis, as fixed (...
[Read more...]

Predicting images using Convolutional neural network

April 24, 2020 | Modeling with R

Introduction Data preparation Training the model: Model Evaluation Prediction Conclusion Introduction In this article we will make use of the convolutional neural network, the most widely deep learning method used for image classification, object detection,..etc1. For more detail about how it works please click here. We are going be ...
[Read more...]

Investments Costs

April 24, 2020 | R on msperlin

Investing is hard. People often
get_perf <- function(starting_cash = 1, 
                     perc_perf = 0.2, 
                     perc_manag = 0.02, 
                     manager_skill_down = 0.8,
                     manager_skill_up = 1.2) {
  
  require(BatchGetSymbols)
  
  df_sp500 <- BatchGetSymbols(tickers = '^GSPC', 
                              first.date = '1950-01-01', last.date = Sys.Date())[[2]]
  
  df_invest <- df_sp500 %>%
    mutate(ref_year = lubridate::year(ref.date)) %>%
    group_by(ref_year) %>%
    summarise(last_price = last(price.adjusted)) %>%
    mutate(ret = last_price/lag(last_price) - 1)
  
  df_out <- tibble()
  port_value <- starting_cash
  invest_value <- starting_cash
  for (i_year in df_invest$ref_year[2:nrow(df_invest)]) {
    
    idx <- which(i_year == df_invest$ref_year)
    ret_year <- df_invest$ret[idx]
    invest_value <- invest_value*(1 + ret_year)

    fund_return <- (ret_year>0)*manager_skill_up*ret_year + 
      (ret_year<=0)*manager_skill_down*ret_year
    
    bench_cost <- (fund_return > 0)*(fund_return - ret_year)*perc_perf*port_value
    management_cost <- port_value*perc_manag
    
    port_value <- port_value*(1+fund_return) - bench_cost - management_cost
    
    df_out <- bind_rows(df_out, tibble(i_year, 
                                       ret_investment = ret_year,
                                       fund_return,
                                       bench_cost,
                                       management_cost,
                                       fund_cost = bench_cost + management_cost,
                                       port_value, 
                                       invest_value))
    
  }
  
  df_tab <- tibble(perc_perf, 
                   perc_manag,
                   manager_skill_down,
                   manager_skill_up,
                   total_ret_asset = last(df_out$invest_value)/starting_cash-1,
                   total_fund_return = last(cumprod(1+df_out$fund_return)) - 1,
                   total_ret_portfolio = last(df_out$port_value)/starting_cash-1,
                   total_cash_fund_cost = sum(df_out$fund_cost),
                   total_cash_investor = last(port_value),
                   CAGR_asset = (1+total_ret_asset)^(1/nrow(df_out))-1,
                   CAGR_fund = (1+total_fund_return)^(1/nrow(df_out))-1,
                   CAGR_portfolio = (1+total_ret_portfolio)^(1/nrow(df_out))-1
                   )
                   
  return(df_tab)
  
}

perc_perf <- 0.2
perc_manag <- 0.02
bench <- 0.05
starting_cash <- 1000
manager_skill_down <- 0.5
manager_skill_up <- 1.5

df_tab <- get_perf(starting_cash = starting_cash , 
                   perc_perf = perc_perf, 
                   perc_manag = perc_manag, 
                   manager_skill_down = manager_skill_down,
                   manager_skill_up = manager_skill_up)
## Loading required package: BatchGetSymbols
## Loading required package: rvest
## Loading required package: xml2
## Loading required package: dplyr
## 
## Attaching package: 'dplyr'
## The following objects are masked from 'package:stats':
## 
##     filter, lag
## The following objects are masked from 'package:base':
## 
##     intersect, setdiff, setequal, union
##
## 
## Running BatchGetSymbols for:
##    tickers =^GSPC
##    Downloading data for benchmark ticker
## ^GSPC | yahoo (1|1) | Found cache file
## ^GSPC | yahoo (1|1) | Found cache file - Got 100% of valid prices | Looking good!
[Read more...]

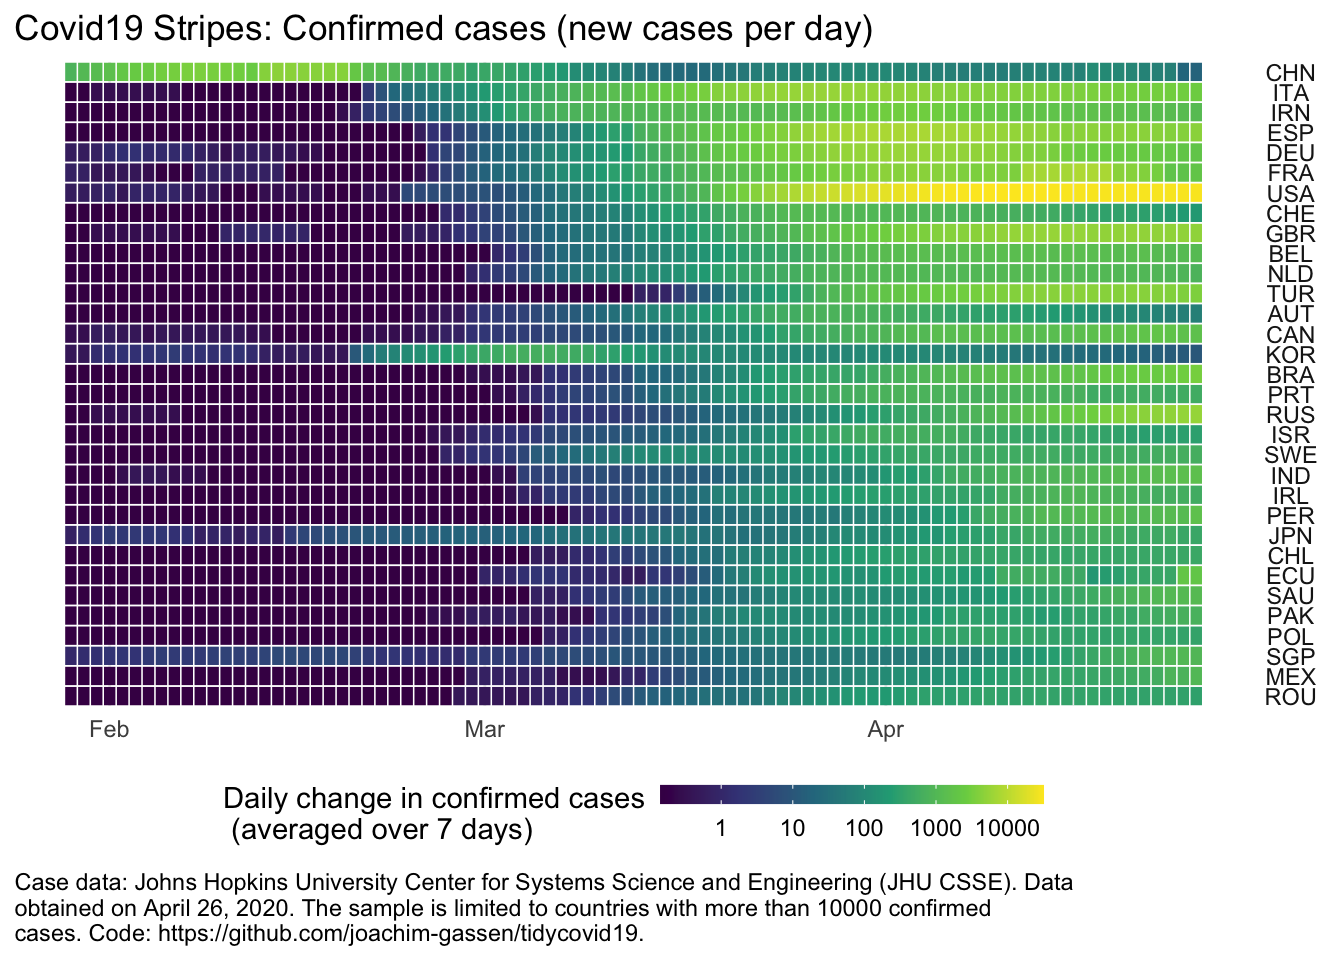
Spectral Heatmaps

April 24, 2020 | R on Chemometrics & Spectroscopy using R

Most everyone is familiar with heatmaps in a general way. It’s hard not to run into them. Let’s consider some variations: A heatmap is a 2D array of rectangular cells colored by value. Generally, the rows and columns are ordered in some purposeful manner. These are very commonly ...
[Read more...]
1 2 3 4 5 6 17

Never miss an update!
Subscribe to R-bloggers to receive
e-mails with the latest R posts.
(You will not see this message again.)

Click here to close (This popup will not appear again)