
Plot outliers and their values
[This article was first published on modTools, and kindly contributed to R-bloggers]. (You can report issue about the content on this page here)
Want to share your content on R-bloggers? click here if you have a blog, or here if you don't.
Want to share your content on R-bloggers? click here if you have a blog, or here if you don't.
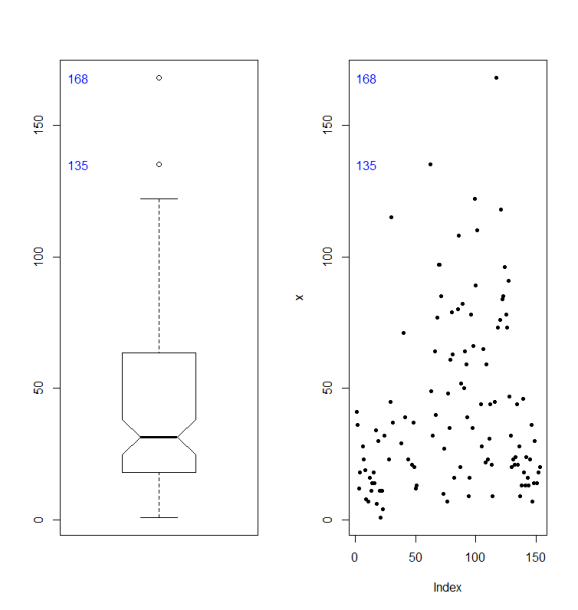
The ‘plot_outliers‘ function below draws a boxplot and a scatterplot of a numeric variable x and plots the values of the outliers (currently not offset, even if they overlap). For relatively small datasets, it can be a quick way to identify which outliers look reasonable and which are likely a result of transcription or measurement error, and thus should be either corrected or discarded.
plot_outliers <- function(x, val_col = "blue", ...) {
  par_in <- par(no.readonly = TRUE)
  par(mfrow = c(1, 2))
  bp <- boxplot(x, ...)
  out <- bp$out
  message(length(out), " outliers detected")
  if (length(out) > 0) text(x = 0.5, y = bp$out, labels = round(out, 2), adj = 0, col = val_col)
  plot(x, pch = 20)
  if (length(out) > 0) text(x = 0.5, y = bp$out, labels = round(out, 2), adj = 0, col = val_col)
  par(par_in)
}
Usage examples:
plot_outliers(iris$Sepal.Width)

Additional arguments for the ‘boxplot‘ function can be provided, e.g.
plot_outliers(airquality$Ozone, notch = TRUE)
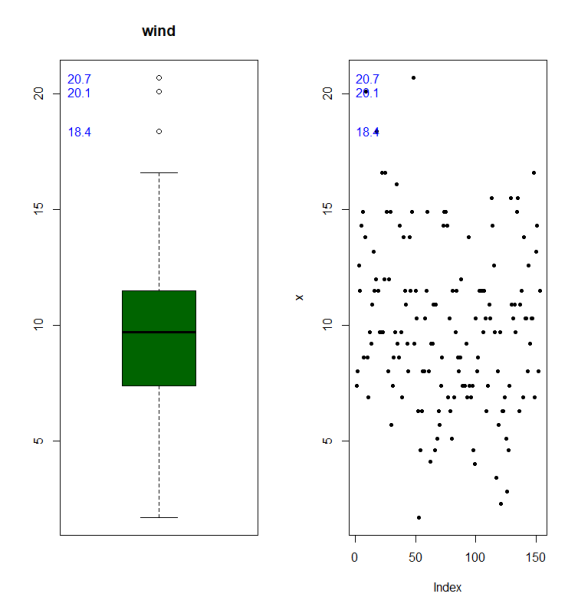
plot_outliers(airquality$Wind, col = "darkgreen", main = "wind")
This function is used in an article which we hope to submit soon.
To leave a comment for the author, please follow the link and comment on their blog: modTools.
R-bloggers.com offers daily e-mail updates about R news and tutorials about learning R and many other topics. Click here if you're looking to post or find an R/data-science job.
Want to share your content on R-bloggers? click here if you have a blog, or here if you don't.