
Cyclists – London Ride 100 – Analysis for riders and clubs using Shiny/R
Want to share your content on R-bloggers? click here if you have a blog, or here if you don't.
Introduction
The Prudential Ride London is an annual summer cycling weekend and within that I will focus on the Ride London-Surrey 100, a 100 mile route open to the public starting at the Stratford Olympic Park in East London and finishing in front of Buckingham Palace.
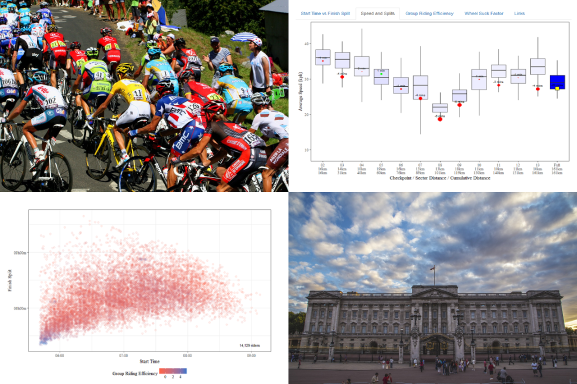
I wrote an initial analysis using R in 2016 and added the 2017 data. In 2018 I added a Shiny interactive web page so that riders could see an analysis of their ride. Below is an image of how that Shiny App looks and here is link to the Shiny page Ride 100 – Shiny Individual Rider Analysis (2019 data has been added).

The Shiny page allows a single rider to be highlighted by entering their “Bib Number”, but works fine without one. It is more interesting if you do enter one though so here is a list of some celebrity* Bib Numbers for 2018 so you can try a few (you will need to change the “Year” selected as the app now also contains the 2019 data). An explanation of how the page works can be found here.
This year I’ve added a variation of the existing Shiny page that focuses on club riders. Here is a link to the Ride 100 – Shiny Club Analysis Page.
General Notes about the new Club Analysis Shiny App
The club analysis was based on the individual analysis page but many of the charts/pages were not appropriate for aggregated data, so were removed.
Club Start Time vs Finish Split
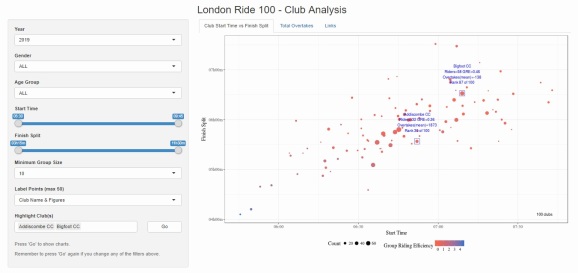
The chart has been modified so that the size of each point reflects the number of riders included. Also a “Minimum Group Size” control, label options and the ability to highlight multiple clubs have been added to the control panel on the left. As before, the colour of each point shows the mean “Group Riding Efficiency” (see previous post about that here).
Total Group Size

This is a new chart that aims to highlight clubs that seem to have been given inappropriately early or late start times in the hope of helping the clubs be more realistic about the start times they request (or maybe even the organisers allocate) for next year.
It calculates how many people each rider overtook (or was overtaken by) over the 100 miles and then sums this figure across all members of the club. If a club has a large number of riders who are doing a lot of overtaking, they should probably be given earlier start times next year. My reasoning is that while a certain amount of overtaking and being overtaken is necessary and healthy, all other things being equal a rider overtaking 5,000* people is more likely to be involved in an accident than the same rider overtaking 500 people. If a club has a lot of riders who did a lot of overtaking the club will be shown as a larger green point in the plot. Similarly clubs which were overtaken by a lot of people are highlighted with a large red point.
Club riders are on average faster than the non-club riders so the data is somewhat skewed to overtakes, but I think the point still stands. Also worthy of note is that the overtake figure only includes overtakes of people who completed the 100 mile course (without diversion). The actual number would be higher, including people doing shorter distances, people who were diverted and people who didn’t manage to finish.
Note: The mean overtakes for each club are shown in the label text on the previous chart and the individual overtake totals are shown on the companion individual analysis Shiny page (see above link)
*this is not an unrealistic figure, some riders overtake more than 10,000 people!
R-bloggers.com offers daily e-mail updates about R news and tutorials about learning R and many other topics. Click here if you're looking to post or find an R/data-science job.
Want to share your content on R-bloggers? click here if you have a blog, or here if you don't.