April 2019

Why RcppDynProg is Written in C++

April 5, 2019 | John Mount

The (matter of opinion) claim: “When the use of C++ is very limited and easy to avoid, perhaps it is the best option to do that […]” (source discussed here) got me thinking: does our own RcppDynProg package actually use C++ in a significant way? Could/should I port it to ...
[Read more...]

How to build Animated Bar Plots using R

April 4, 2019 | Abdul Majed Raja

CategoriesVisualizing Data Tags Animation Data Visualisation R Programming Recently, Animated Bar Plots have started going Viral on Social Media leaving a lot of Data Enthusiasts wondering how are these Animated Bar Plots made. The objective of this post is to explain how to build such an Animated Bar Plot using ... [Read more...]

Archer and Tidy Data Principles (Part 3)

April 4, 2019 | Pachá

Motivation The first and second part of this analysis gave the idea that I did too much scrapping and processing and that deserves more analysis to use that information well. In this third and final part I’m also taking a lot of ideas from Julia Si...
[Read more...]

Gravity Falls and Tidy Data Principles (Part 3)

April 4, 2019 | Pachá

Motivation The first and second part of this analysis gave the idea that I did too much scrapping and processing and that deserves more analysis to use that information well. In this third and final part I’m also taking a lot of ideas from Julia Si...
[Read more...]

Archer and Tidy Data Principles (Part 3)

April 4, 2019 | Pachá

Motivation The first and second part of this analysis gave the idea that I did too much scrapping and processing and that deserves more analysis to use that information well. In this third and final part I’m also taking a lot of ideas from Julia Silge’s blog. In ...
[Read more...]

Gravity Falls and Tidy Data Principles (Part 3)

April 4, 2019 | Pachá

Motivation The first and second part of this analysis gave the idea that I did too much scrapping and processing and that deserves more analysis to use that information well. In this third and final part I’m also taking a lot of ideas from Julia Silge’s blog. In ...
[Read more...]

How to Animate a Control Chart

April 4, 2019 | R on jmarriott.com

Recently, I wrote a post about creating control charts in R, and now I want to experiment with animating one of those charts. 
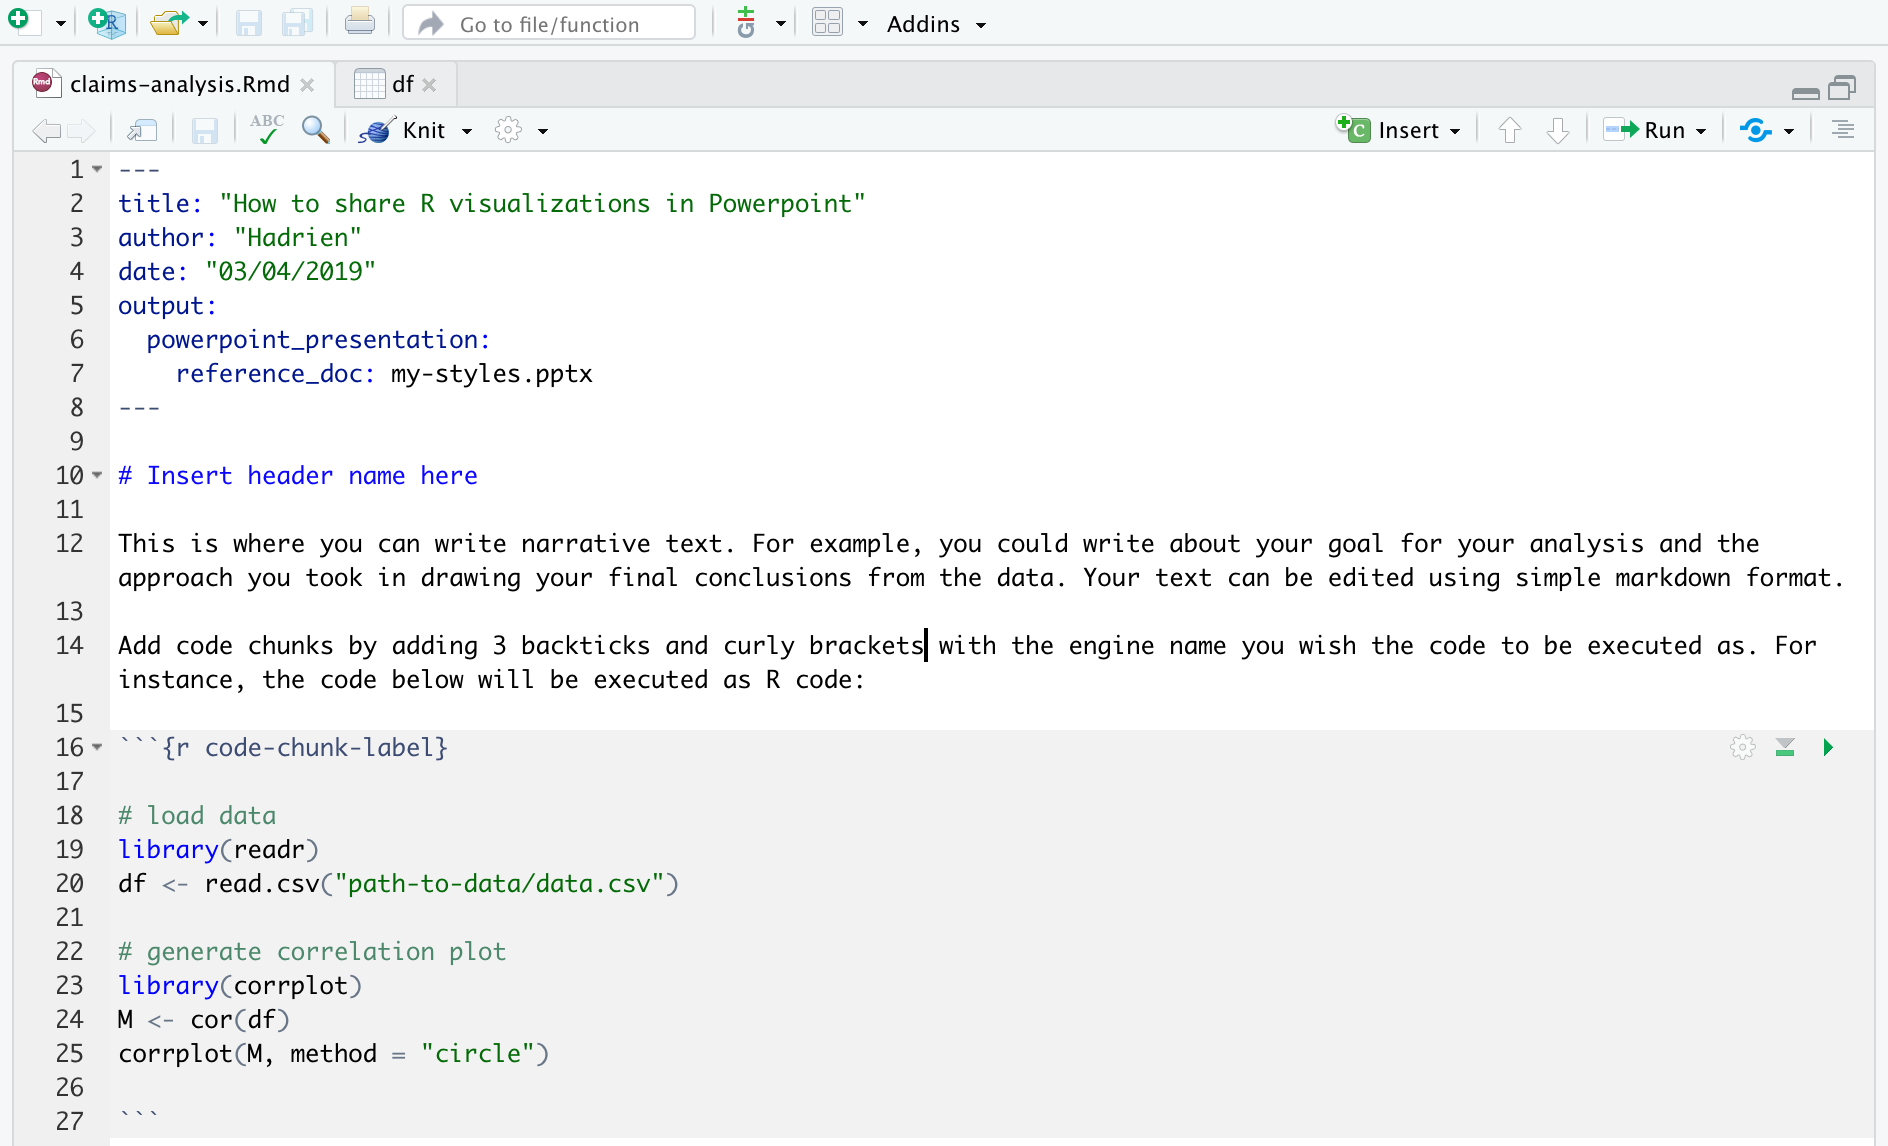
Lets start with the tidyverse, gganimate, and ggQC.
library(tidyverse)
library(gganimate)
library(ggQC)
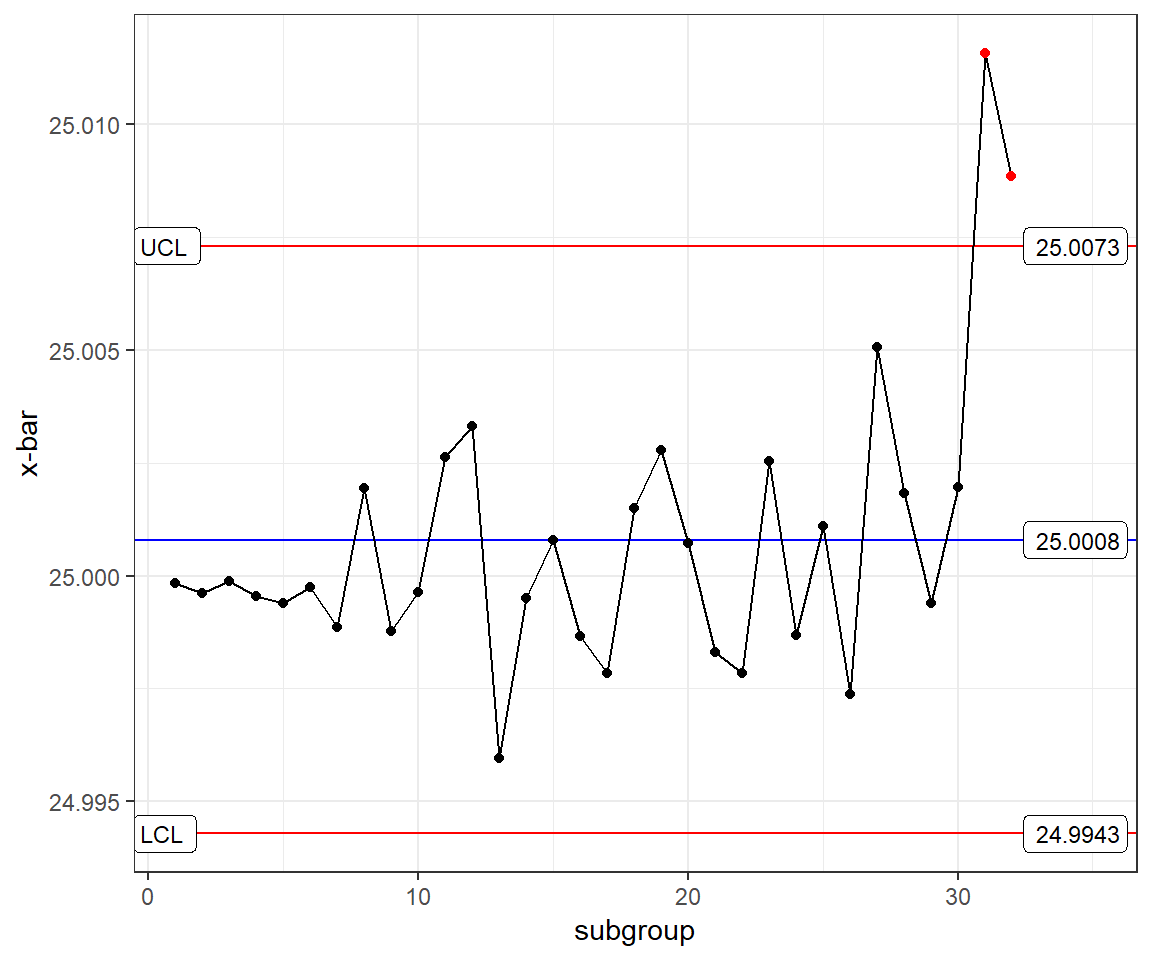
Now, lets rebuild the last control chart from my previous post.
# Generate sample data
set.seed(20190117)
example_df <- data_frame(values = rnorm(n=30*5, mean = 25, sd = .005),
                         subgroup = rep(1:30, 5),
                         n = rep(1:5, each = 30)) %>%
  add_row(values = rnorm(n=2*5, mean = 25 + .006, sd = .005),
          subgroup = rep(31:32, 5),
          n = rep(1:5, each = 2)) 

violations <- example_df %>%
  QC_Violations(value = "values", grouping = "subgroup", method = "xBar.rBar") %>%
  filter(Violation == TRUE) %>%
  select(data, Index) %>%
  unique()

ggQC_example <- example_df %>%
  ggplot(aes(x = subgroup, y = values)) +
  stat_summary(fun.y = mean, geom = "line", aes(group = 1)) +
  stat_summary(fun.y = mean, geom = "point", aes(group = 1)) +
  stat_QC(method = "xBar.rBar", auto.label = TRUE, label.digits = 4) +
  scale_x_continuous(expand =  expand_scale(mult = c(.05, .15))) + # Pad the x-axis for the labels
  ylab("x-bar") +
  theme_bw() +
  geom_point(data = violations, aes(x = Index, y = data), color = "red", group = 1)
ggQC_example
You can see that I added ...
[Read more...]

Gravity Falls and Tidy Data Principles (Part 3)

April 4, 2019 | Pachá

Motivation The first and second part of this analysis gave the idea that I did too much scrapping and processing and that deserves more analysis to use that information well. In this third and final part I’m also taking a lot of ideas from Julia Silge’s blog. In ...
[Read more...]

Archer and Tidy Data Principles (Part 3)

April 4, 2019 | Pachá

Motivation The first and second part of this analysis gave the idea that I did too much scrapping and processing and that deserves more analysis to use that information well. In this third and final part I’m also taking a lot of ideas from Julia Silge’s blog. In ...
[Read more...]

What are the Popular R Packages?

April 4, 2019 | John Mount

“R is its packages”, so to know R we should know its popular packages (CRAN). Or put it another way: as R is a typical “the reference implementation is the specification” programming environment there is no true “de jure” R, only a de facto R. To look at popular R ...
[Read more...]

How to share R visualizations in Microsoft PowerPoint

April 3, 2019 | R Views

Hadrien Dykiel is an RStudio Customer Success Engineer Microsoft PowerPoint is often the de facto choice for creating presentation slides, especially at larger companies. In many organizations, it comes pre-installed on workstations and pretty much everybody knows how to use it. This can make it an effective medium for sharing ...
[Read more...]

What is a Permutation Test?

April 3, 2019 | Dave Giles

Permutation tests, which I'll be discussing in this post, aren't that widely used by econometricians. However, they shouldn't be overlooked.Let's begin with some background discussion to set the scene. This might seem a bit redundant, but it will help us to see how permutation tests differ from the sort ...
[Read more...]
1 11 12 13 14 15

Never miss an update!
Subscribe to R-bloggers to receive
e-mails with the latest R posts.
(You will not see this message again.)

Click here to close (This popup will not appear again)