
Quickly create Codeplans of your (labelled) Data #rstats
Want to share your content on R-bloggers? click here if you have a blog, or here if you don't.
The view_df() function from the sjPlot-package creates nice „codeplans“ from your data sets, and also supports labelled data and tagged NA-values. This gives you a comprehensive, yet clear overview of your data set.
To demonstrate this function, we use a (labelled) data set from the European Social Survey. view_df() produces a HTML-file, that is – when you use RStudio – displayed in the viewer pane, or it can be opened in your webbrowser.
Default codeplan
In this blog post, I used screenshots of the created HTML-tables, because else the formatting gets lost in this blog…
We start with using the „standard“ output.
library(sjlabelled)
library(sjPlot)

# load data, tag NA-values with 'tag.na = TRUE'
ess <- read_spss("ESS8e02_1.sav", tag.na = TRUE)

# "standard" output. we only use selected variables
# for demonstration purposes
view_df(ess[, c(1,2,6,8,149,151,532)], max.len = 10)

As you can see, values for string variables are not shown by default, as these typically clutter up the output. Furthermore, values for variables with many different values are truncated at some point, to avoid too long tables that are not readable anymore.
Since the functions in sjPlot support labelled data, you see both values and associated value labels in the output, as well as different NA-values, so called tagged NA’s (which are often used in SPSS or Stata, less in R, though). Tagged NA’s can also have value labels (e.g. „unknown“, „no answer“ etc.), however, in the above example, the tagged NA-values have no value labels.
Finally, for numeric (continuous) variables that are not labelled, these typically span over a larger range. In such cases, printing all values is not very informative, so view_df() prints the range of these variables instead.
Adding more information to the codeplan
view_df() offers many options, e.g. to add the frequencies of values, the amount of missing values per variable, or even weighted frequencies.
# show many information...
view_df(
  ess[, c(1,2,6,8,149,151,532)],
  show.na = TRUE,
  show.type = TRUE,
  show.frq = TRUE,
  show.prc = TRUE,
  show.string.values = TRUE,
  show.id = TRUE
)

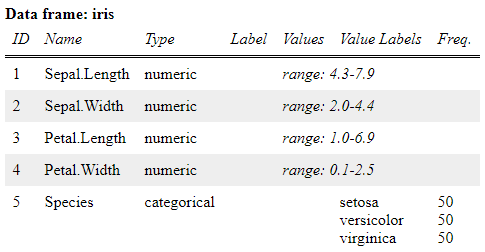
Non-labelled data sets
Of course you can also use non-labelled data with this function…
# works with non-labelled data as well, of course...
view_df(iris, show.frq = TRUE, show.type = TRUE)
R-bloggers.com offers daily e-mail updates about R news and tutorials about learning R and many other topics. Click here if you're looking to post or find an R/data-science job.
Want to share your content on R-bloggers? click here if you have a blog, or here if you don't.