February 2019

A Look Back on 2018: Part 2

February 11, 2019 | R Views

Welcome to the second installment of Reproducible Finance 2019! In the previous post, we looked back on the daily returns for several market sectors in 2018. Today, we’ll continue that theme and look at some summary statistics for 2018, and then extend out to previous years and different ways of visualizing our ...
[Read more...]

RFM Analysis in R

February 11, 2019 | Rsquared Academy Blog

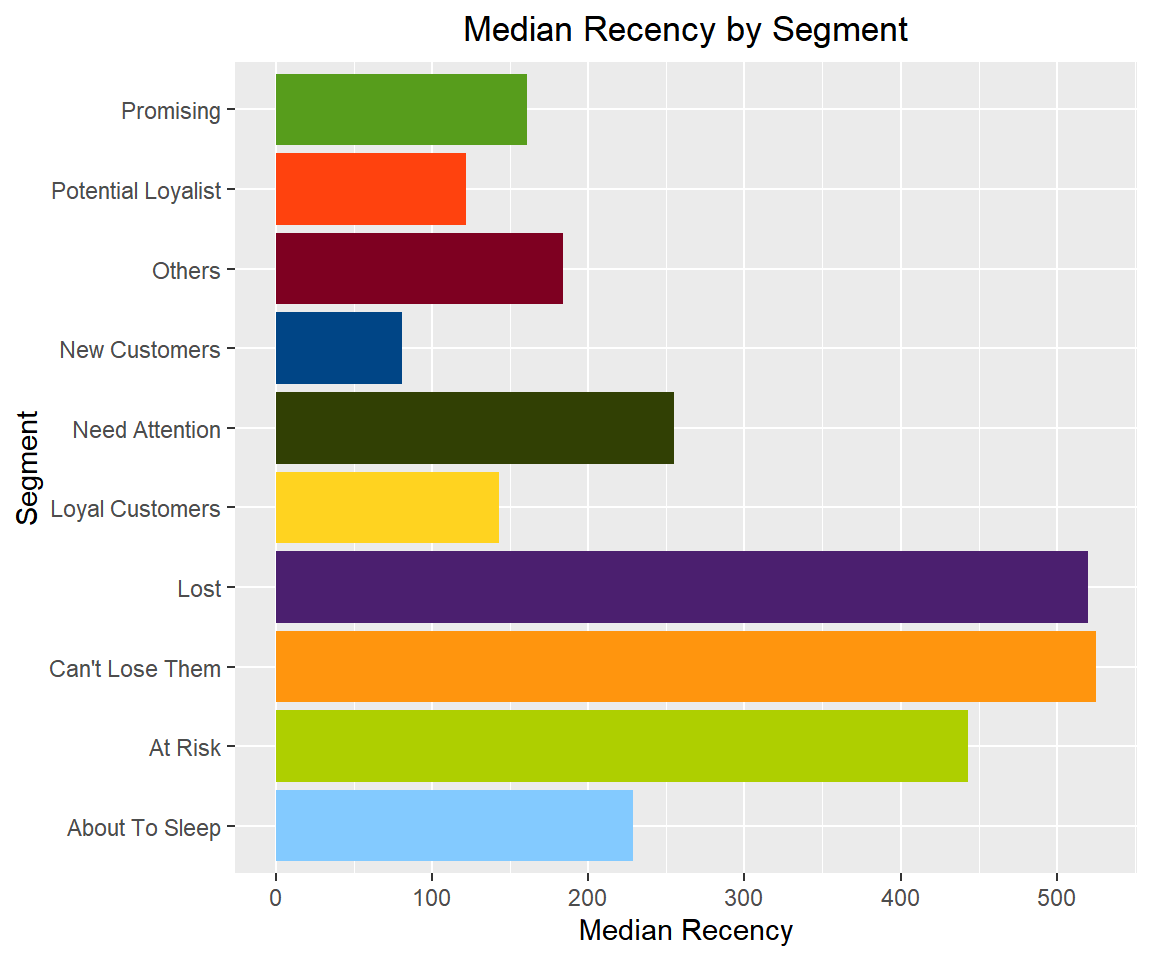
We are pleased to announce the rfm package, a set of tools for recency, frequency and monetary value analysis, designed keeping in mind beginner/intermediate R users. It can handle: transaction level data customer level data Installation
# Install release version from CRAN
install.packages("rfm")

# Install development version from GitHub
# install.packages("devtools")
devtools::install_github("rsquaredacademy/rfm")
Shiny App rfm includes a shiny app which can be launched using {{...
[Read more...]

cdata Control Table Keys

February 11, 2019 | John Mount

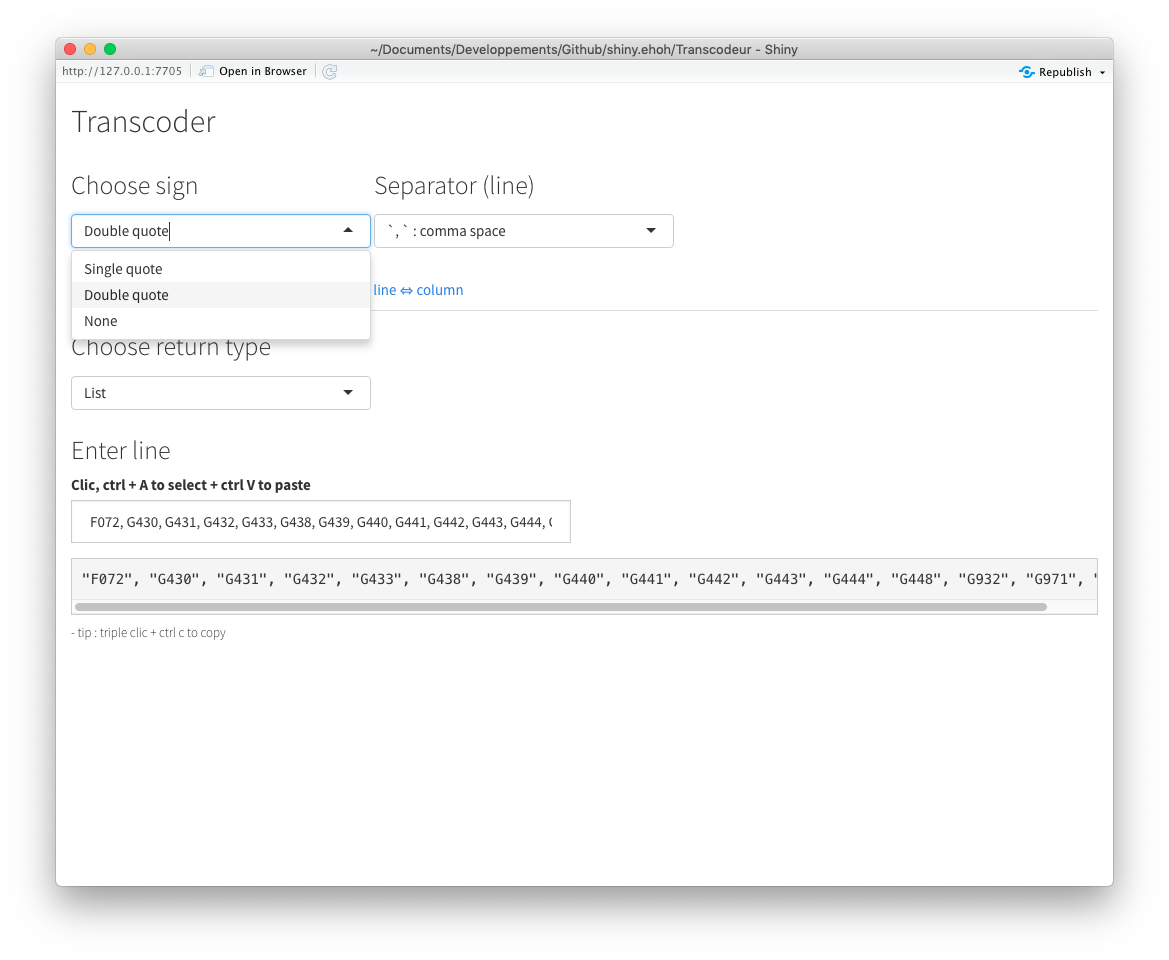
In our cdata R package and training materials we emphasize the record-oriented thinking and how to design a transform control table. We now have an additional exciting new feature: control table keys. The user can now control which columns of a cdata control table are the keys, including now using ... [Read more...]

Direct Optimization of Hyper-Parameter

February 10, 2019 | statcompute

In the previous post (https://statcompute.wordpress.com/2019/02/03/sobol-sequence-vs-uniform-random-in-hyper-parameter-optimization), it is shown how to identify the optimal hyper-parameter in a General Regression Neural Network by using the Sobol sequence and the uniform random generator respectively through the N-fold cross validation. While the Sobol sequence yields a slightly better performance, outcomes ... [Read more...]

A Through the Cycle Geo-Spatial Analysis of CT Town Finances

February 10, 2019 | R on Redwall Analytics

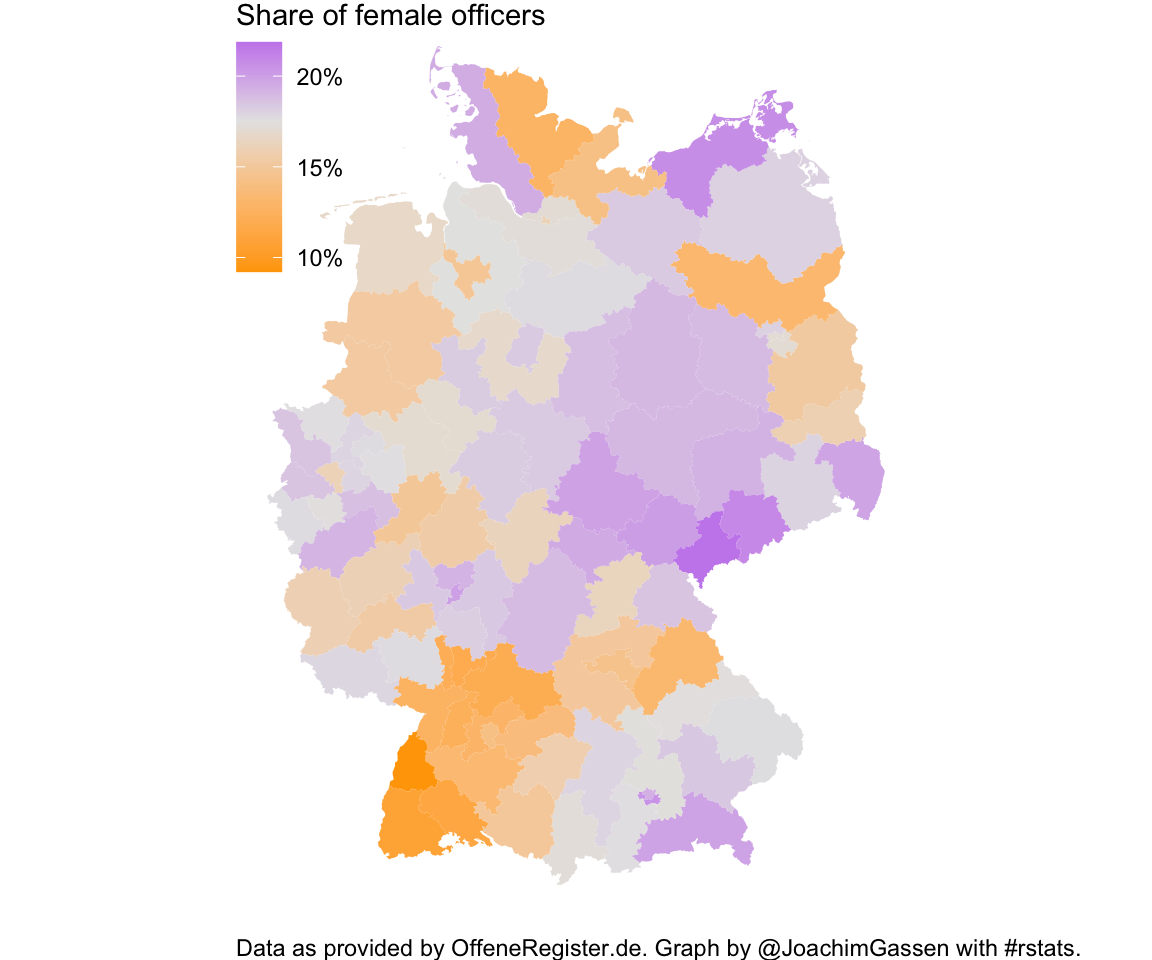
Introduction In an earlier post, Reviewing Fairfield County Municipal Fiscal Indicators Since 2001, we used 17 years of individual Town Comprehensive Annual Financial Reports (CAFR) aggregated in Connecticut’s Municipal Fiscal Indicator’s to compare 15 Fairfield County towns. The challenge was that the graphs became crowded even with that small number of ... [Read more...]

Testing out ggQC

February 10, 2019 | R on jmarriott.com

R is a great language for statistical process control largely because there are several packages which make it quite easy, including qcc, SixSigma, and a new one that I want to explore in this post called ggQC. I’ve been using qcc for a while and I trust its calculations, ...
[Read more...]

Shiny Modules (part 1) : Why using modules ?

February 10, 2019 | ArData

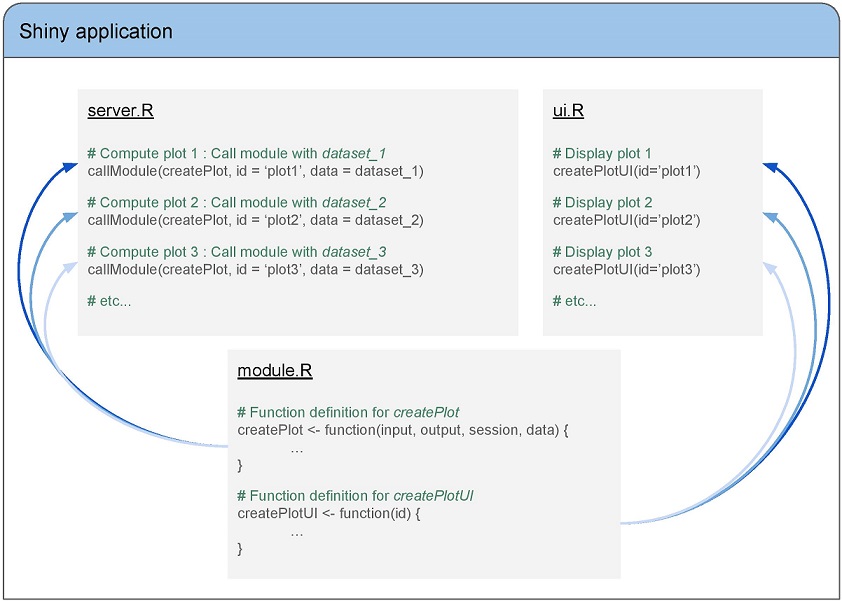
Short introduction to Shiny modules Building complex Shiny application can lead to code duplication. Shiny modules are the solution to this code duplication. A Shiny module is a piece of a Shiny app reusable inside more complex app. Thus, a module can be seen as a function that could be ...
[Read more...]

Multilevel Modelling in R: Analysing Vendor Data

February 10, 2019 | Michael Grogan

CategoriesRegression Models Tags Linear Mixed Model Linear Regression R Programming One of the main limitations of regression analysis is when one needs to examine changes in data across several categories. This problem can be resolved by using a multilevel model, i.e. one that varies at more than one level ...
[Read more...]
1 7 8 9 10 11 13

Never miss an update!
Subscribe to R-bloggers to receive
e-mails with the latest R posts.
(You will not see this message again.)

Click here to close (This popup will not appear again)