December 2018

Six Sigma DMAIC Series in R – Part4

December 15, 2018 | Kamal Kumar

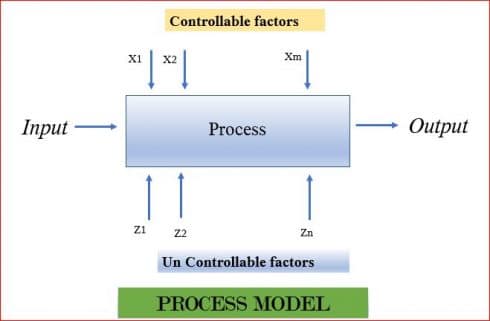
CategoriesBasic Statistics Tags Data Visualisation Linear Regression R Programming Hope you liked the Part 1 ,Part 2 and Part 3 of this Series. In this Part 4, we will go through the tools used during the Improve phase of Six Sigma DMAIC cycle. The most representative tool used during the Improve Phase is DOE-Design ...
[Read more...]

Nesting Birds and Models in R Dataframes

December 15, 2018 | Laurens Geffert

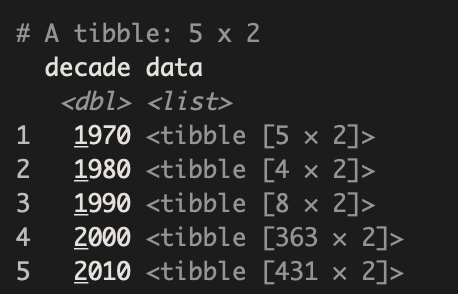
R Dataframes in the tidyverse are more than just simple tables these days. They can store complex information in list columns, and this becomes an immensely powerful framework when we use it to apply methods to different sets of data in parallel. In th...
[Read more...]

Cities boomed and doomed

December 14, 2018 | R & Census

Population in the United States grew by 3.76% from 313.91 million in 2012 to 325.72 million in 2017. The growth, however, is not uniform geographically. One of the geographical areas of particular interest is the city. Some cities are shrinking in population while some others exploding. The purpose of this post is to find cities ... [Read more...]

RStudio Pandoc – HTML To Markdown

December 14, 2018 | R on YIHAN WU

The knitr and rmarkdown packages are used in conjunction with pandoc to convert R code and figures to a variety of formats including PDF, and word. Here, I’m exploring how to convert HTML back to markdown format. This post came about when I was searching how to convert XML ... [Read more...]

In case you missed it: November 2018 roundup

December 14, 2018 | David Smith

In case you missed them, here are some articles from November of particular interest to R users. David Gerard assesses the plausibility of a key plot point in 'Jurassic Park' with simulations in R. In-database R is available in Azure SQL Database for private preview. Introducing AzureR, a new suite ... [Read more...]

Day 14 – little helper print_fs

December 14, 2018 | Jakob Gepp

This little helper returns the folder structure of a given path. With this, one can for example add a nice overview to the documentation of a project or within a git. Der Beitrag Day 14 – little helper print_fs erschien zuerst auf STATWORX.
[Read more...]

running plot [and simulated annealing]

December 14, 2018 | xi'an

Last weekend, I found out a way to run updated plots within a loop in R, when calling plot() within the loop was never updated in real time. The above suggestion of including a Sys.sleep(0.25) worked perfectly on a simulated annealing example for deter...
[Read more...]

Building an R package that includes RcppArmadillo code

December 13, 2018 | Ricardo

[This is the second post in a three part series that demonstrates how to create an R package that includes RcppArmadillo source code. Follow these links for part one and part three] Last time I showed how you might speed up getting the coefficients from a linear regression.  Comparisons once ...
[Read more...]

Growing old in Twitter

December 13, 2018 | R on Implicit None

I started using Twitter more than 10 years ago (!). I open an account in this social network in 2008 and although I was not using it too much for the first year, I become a frequent user after that. It has helped me to get news, information both for my personal and ... [Read more...]

Reusable Pipelines in R

December 13, 2018 | John Mount

Pipelines in R are popular, the most popular one being magrittr as used by dplyr. This note will discuss the advanced re-usable piping systems: rquery/rqdatatable operator trees and wrapr function object pipelines. In each case we have a set of objects designed to extract extra power from the wrapr ... [Read more...]
1 4 5 6 7 8 13

Never miss an update!
Subscribe to R-bloggers to receive
e-mails with the latest R posts.
(You will not see this message again.)

Click here to close (This popup will not appear again)