November 2018

Til I Die: Seeking new music

November 30, 2018 | quantixed

I’ve been following the tweets from an account called Albums You Must Hear @Albums2Hear. Each tweet is an album recommended by the account owner. I’m a sucker for lists of Albums That I Must Hear Before I Die since I’m always interested in new (or not ... [Read more...]

Simulating dinosaur populations, with R

November 30, 2018 | David Smith

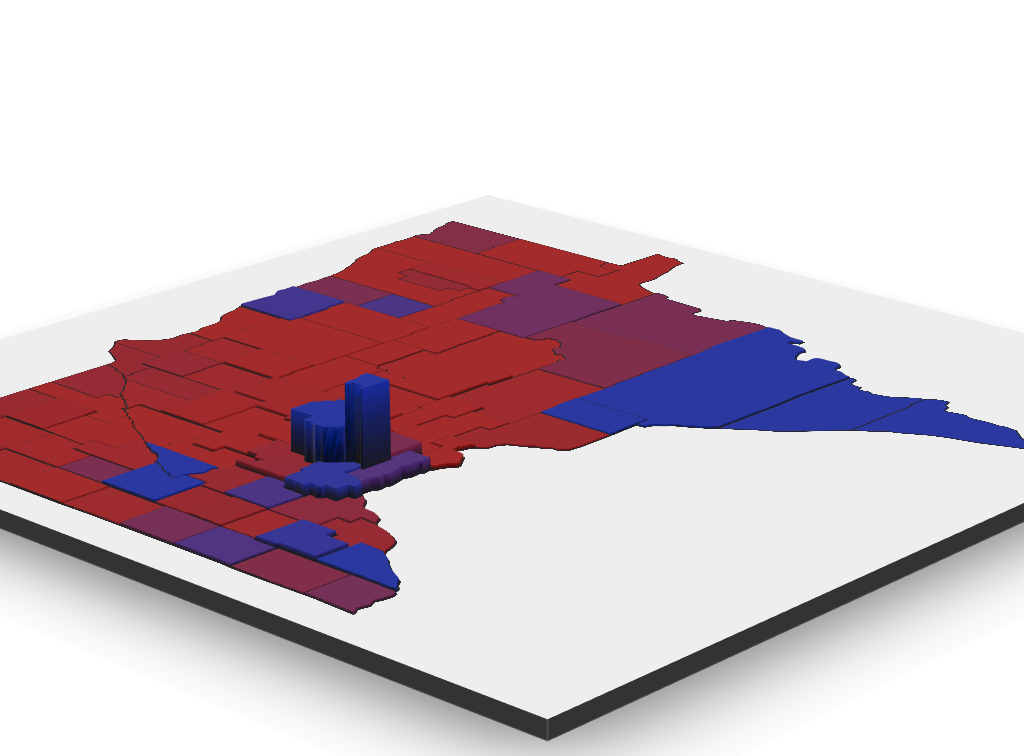
So it turns out that the 1990 Michael Crichton novel Jurassic Park is, indeed, a work of fiction. (Personal note: despite the snark to follow, the book is one of my all-time favorites — I clearly remember devouring it in 24 hours straight while ill in a hostel in France.) If the monsters ... [Read more...]

A simple function to create nice correlation plots

November 30, 2018 | Gary Hutson

The problem I was working with a dataset where I wanted to assess the correlation of different variables in R. As much as I like R – the outputs from the console window leave something to be desired (in terms of data visualisation). Therefore, I wanted a way to visualise these ... [Read more...]

NYC buses: Cubist regression with more predictors

November 30, 2018 | Nils Ross

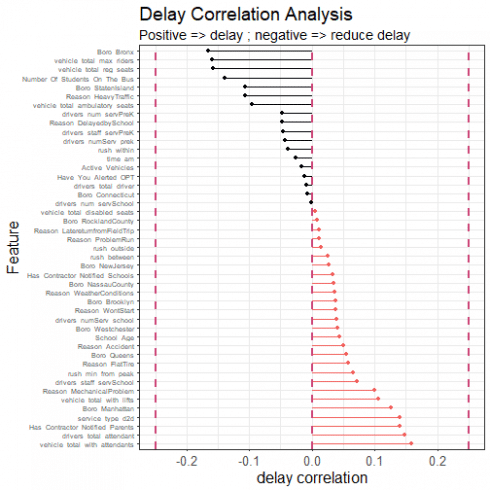
CategoriesAdvanced Modeling Tags Data Management Linear Regression R Programming We have previously added a set of company identity-agnostic predictors, such as the number of drivers a company employs, or the number of vehicles in the fleet with a hydraulic lift, and so on. we took this approach, rather than having ...
[Read more...]

Faster garbage collection in pqR

November 29, 2018 | Radford Neal

The latest version of pqR and the version before as well use a new garbage collector, and new memory layouts for R objects, which both reduce memory usage and considerably speed up garbage collection. Here, I’ll give an overview of how the new scheme works, and present some performance ...
[Read more...]

Automatic (slides) for the people

November 29, 2018 | HighlandR

Creating and saving multiple plots to Powerpoint At the NHS R conference we delivered a session on animating patient flow. This started with a single plot showing all patient movements, and then I demonstrated the ability to create a faceted... [Read more...]

Linear, Quadratic, and Regularized Discriminant Analysis

November 29, 2018 | R on datascienceblog.net: R for Data Science

Discriminant analysis encompasses methods that can be used for both classification and dimensionality reduction. Linear discriminant analysis (LDA) is particularly popular because it is both a classifier and a dimensionality reduction technique. Quadratic discriminant analysis (QDA) is a variant of LDA that allows for non-linear separation of data. Finally, regularized ...
[Read more...]

DBnomics R client, a tutorial

November 29, 2018 | Thomas Brand

DBnomics : the world’s economic database You can explore all the economic data from different providers by following the link db.nomics.world. You can also retrieve all the economic data through the rdbnomics package here. This blog post describes the different ways to do so. Fetch time series by ...
[Read more...]

Request for Proposal: Topical Projects for January 2019

November 29, 2018 | David Venturi

Hi, internet! DataCamp launches at least one DataCamp project a month that is topical for that specific month, and you (yes, you) should create one for January 2019. For example, in October, we launched a Halloween-related project called Explore 538's Halloween Candy Rankings by Nick Solomon. In that project, DataCamp subscribers ...
[Read more...]

NYC buses: simple Cubist regression

November 29, 2018 | Nils Ross

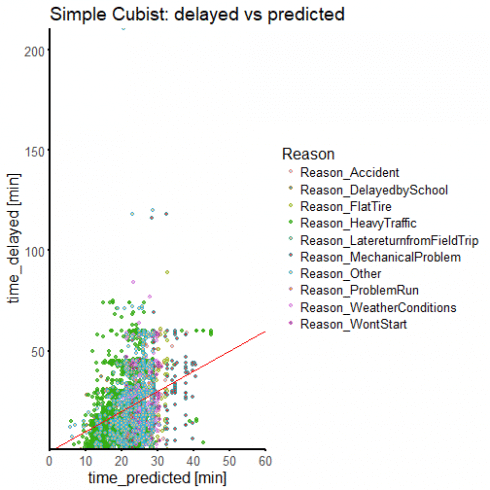
CategoriesAdvanced Modeling Tags Data Manipulation Machine Learning R Programming Tips & Tricks We continue on from our previously loaded data of NYC bus delays. Although we are fairly sure that our target variable (time_delayed) is not accurate, it is all we have. We can thank the bus drivers of New ...
[Read more...]

Plotting Traditional Colours of Japan

November 28, 2018 | R on Chi's Impe[r]fect Blog

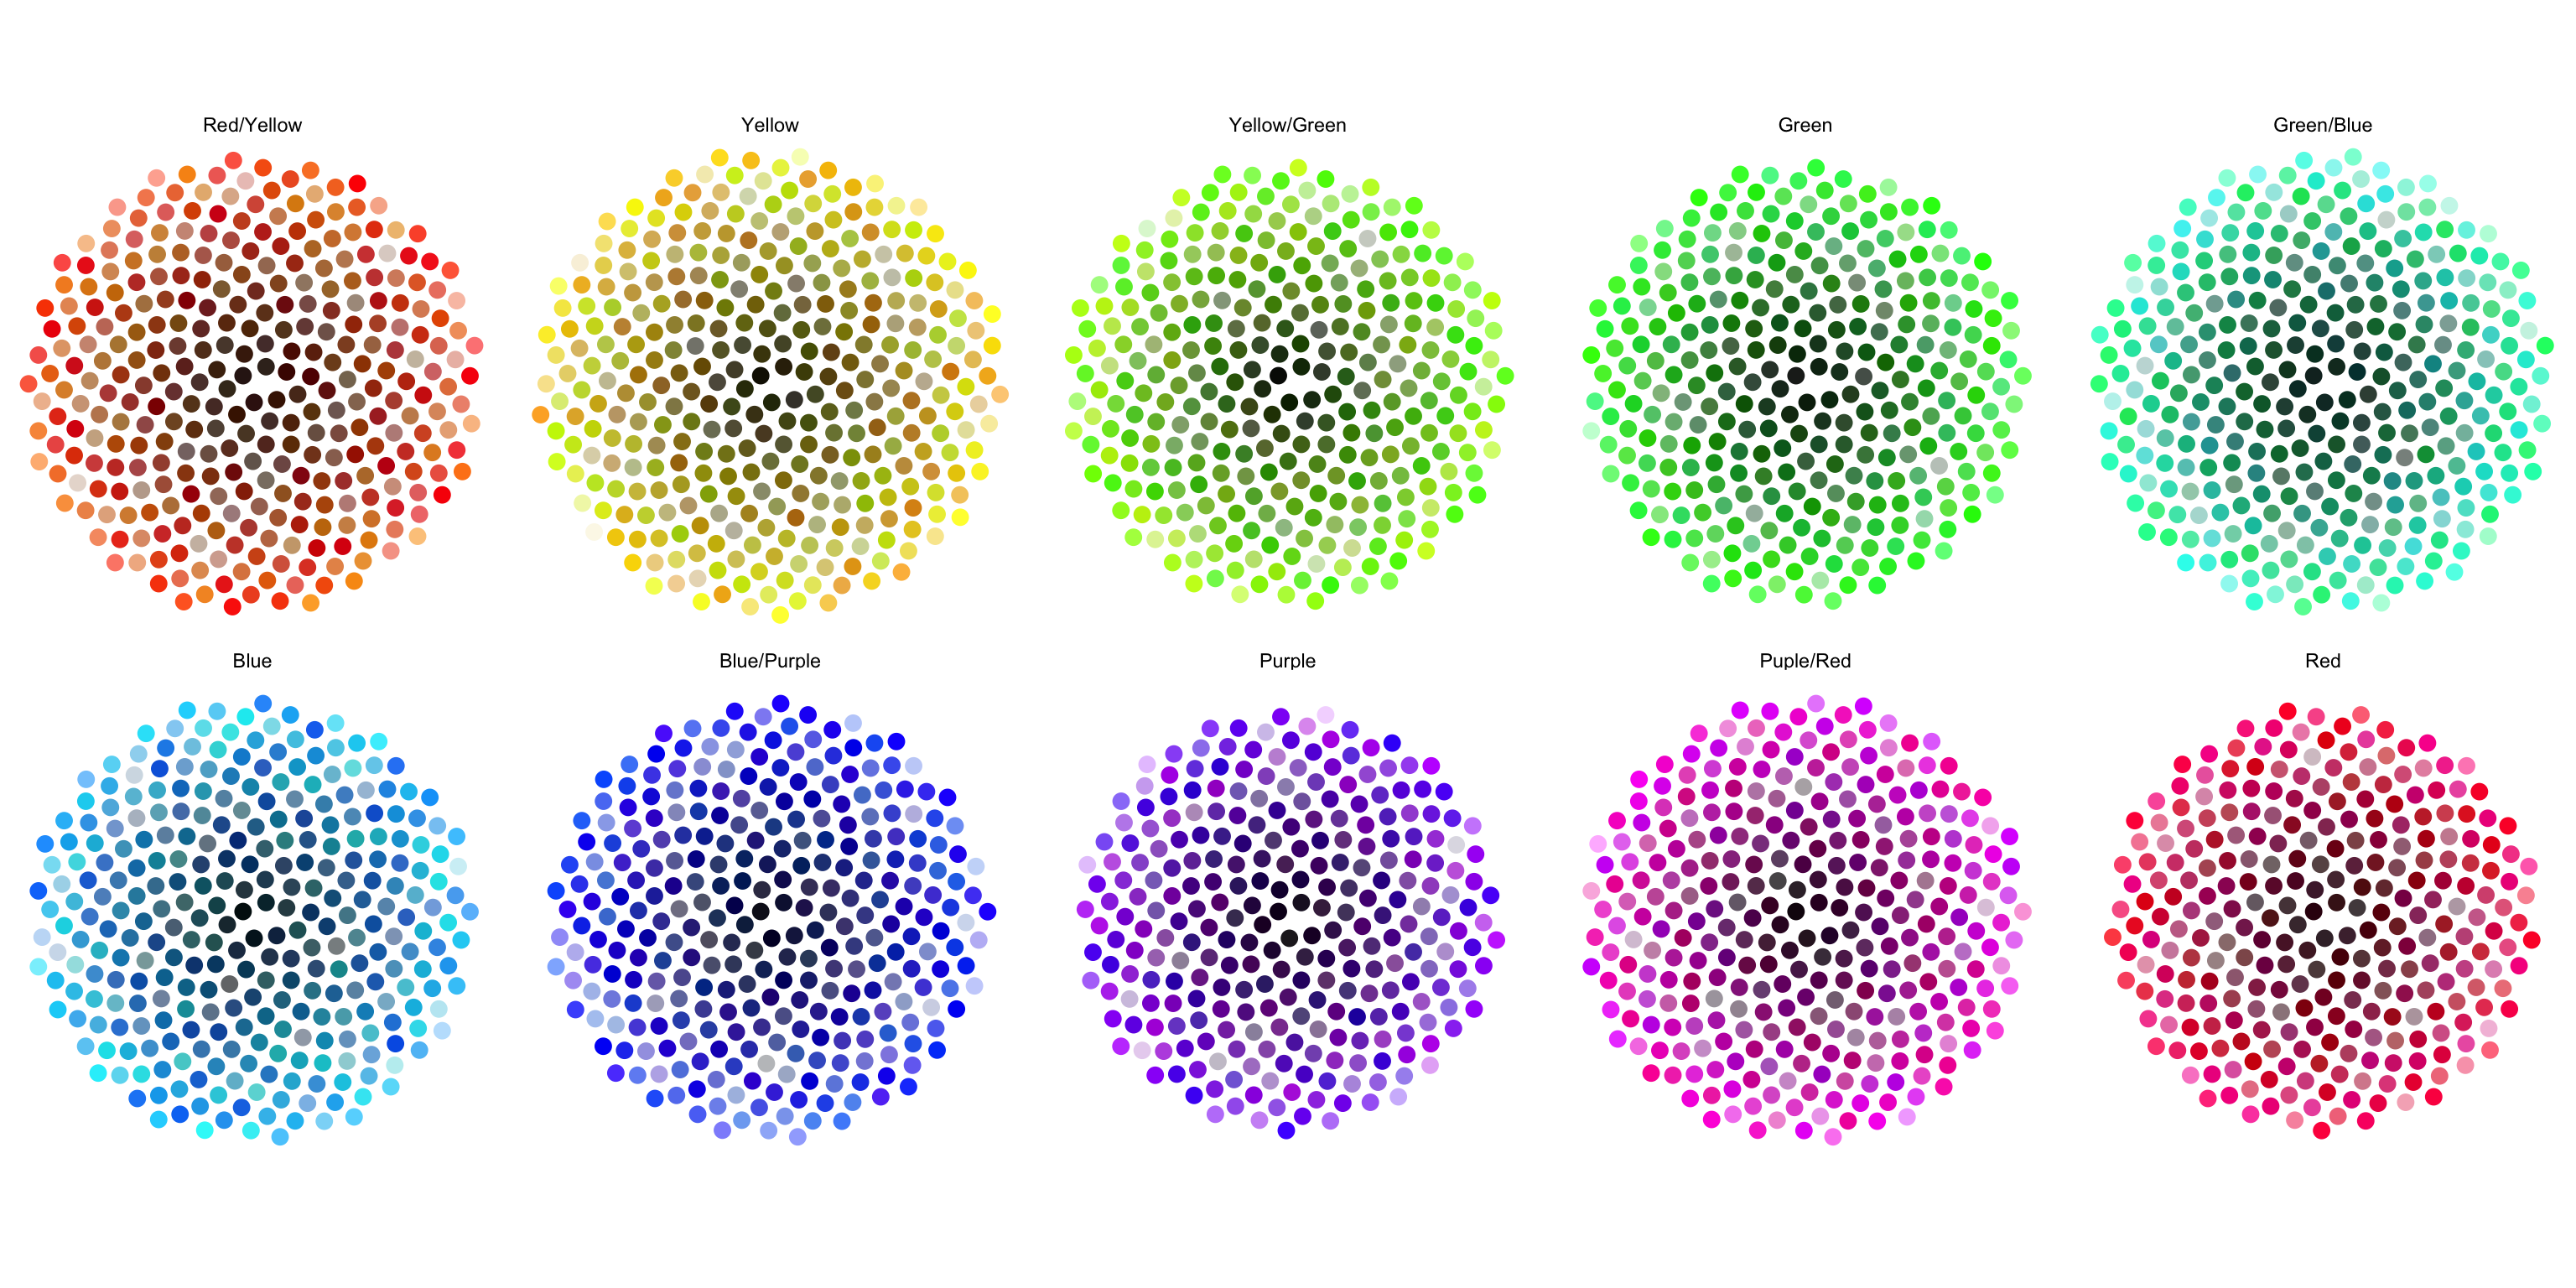
I was curious to know what colours were Traditional Colours of Japan. One of the site I came across showing 465 palettes of Japanese colour is this one. Japanese Site with 465 palettes of traditional colour. While site displays colour beautifully, to see every colour you need to scroll quite bit, so ...
[Read more...]

October 2018: “Top 40” New Packages

November 28, 2018 | R Views

One hundred eighty-five new packages made it to CRAN in October. Here are my picks for the “Top 40” in eight categories: Computational Methods, Data, Machine Learning, Medicine, Science, Statistics, Utilities, and Visualization. Computational Methods compboost v0.1.0: Provides a C++ implementation of component-wise boosting written to obtain high run-time performance and ...
[Read more...]
1 2 3 15

Never miss an update!
Subscribe to R-bloggers to receive
e-mails with the latest R posts.
(You will not see this message again.)

Click here to close (This popup will not appear again)