May 2018

How to make a generic stat in ggplot2

May 15, 2018 | Code R

For a while now I’ve been thinking that, yes, ggplot2 is awesome and offers a lot of geoms and stats, but it would be great if it could be extended with new user-generated geoms and stats. Then I learnt that ggplot2 actually has a pretty great extension system so ...
[Read more...]

Cleaning up tables

May 15, 2018 | R on Abhijit Dasgupta

Context One of things I have to do quite often is create tables for papers and presentations. Often the “Table 1” of a paper has descriptives about the study, broken down by subgroups. For presentation purposes, it doesn’t look good (to me, at least) that the name of each subgroup ... [Read more...]

Enterprise Dashboards with R Markdown

May 15, 2018 | R Views

This is a second post in a series on enterprise dashboards. See our previous post, Enterprise-ready dashboards with Shiny Databases. We have been living with spreadsheets for so long that most office workers think it is obvious that spreadsheets generated with programs like Microsoft Excel make it easy to understand ...
[Read more...]

Using recurrent neural networks to segment customers

May 15, 2018 | tvladeck

Understanding consumer segments is key to any successful business. Analytically, segmentation involves clustering a dataset to find groups of similar customers. Traditional approaches are often limited to certain data structures. Breaking out of these restrictions has been one of our top priorities since starting the company.
[Read more...]

grconvertX and grconvertY

May 15, 2018 | aghaynes

These two functions are unbelievably useful for positioning graphical elements (text, axes, labels, …) in R. They allow one to convert coordinates between various different formats. For instance, you can convert your user coordinate (say 5 where x ranges from 0 to 200) to normalized device coordinates (proportional distance across the device) and vice ...
[Read more...]

DALEX @ eRum 2018

May 15, 2018 | smarterpoland

DALEX invasion has started with the workshop and talk @ eRum 2018. Find workshop materials at DALEX: Descriptive mAchine Learning EXplanations. Tools for exploration, validation and explanation of complex machine learning models (thanks Mateusz Staniak for having the second part of the workshop). And my presentation Show my your model 2.0! (thanks go ... [Read more...]

Time Series of the World, Unite!

May 15, 2018 | usefulr

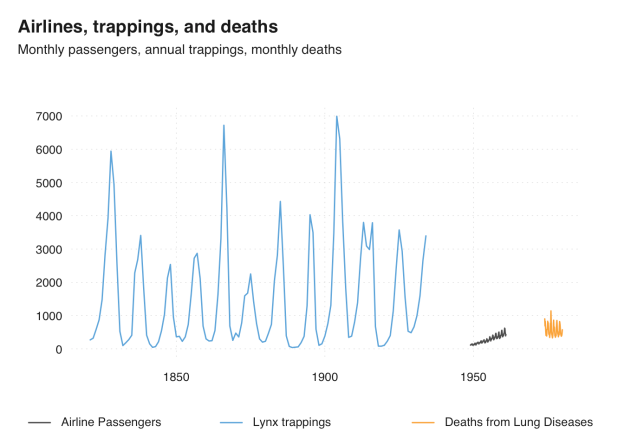
The R ecosystem knows a ridiculous number of time series classes. So, I decided to create a new universal standard that finally covers everyone’s use case… Ok, just kidding! tsbox, now freshly on CRAN, provides a set of tools that are agnostic towards existing time series classes. It is ...
[Read more...]

The Pleasing Ratio Project

May 15, 2018 | @aschinchon

Music is a world within itself, with a language we all understand (Sir Duke, Stevie Wonder) This serious man on the left is Gustav Theodor Fechner, a German philosopher, physicist and experimental psychologist who lived between 1801 and 1887. To be honest, I don’t know almost anything of his life or ...
[Read more...]

Visualisation of Fantasy Points

May 14, 2018 | Analysis of AFL

Recently I was on twitter and saw this tweet here. Being a Connor Blakely fan I thought to myself I wonder if those are actualy good odds and if I could visualise this. So what is the theme of the thread, well it seems as though Chris and SgtButane think ...
[Read more...]

icon: web icons for rmarkdown

May 14, 2018 | rOpenSci - open tools for open science

Icons in R The icon package provides a convenient interface for adding icons from popular web fonts to R Markdown documents. The project began at rOpenSci OzUnconf 2017, and was developed by Mitchell O’Hara-Wild, Earo Wang and Timothy Hyndman. The package currently supports icons from Font Awesome, Academicons, and ionicons. ...
[Read more...]

fruit: Image-Based Systems of Linear Equations (Numeric)

May 14, 2018 | R/exams

Exercise template for solving a system of three linear equations (numeric answer) with a problem description based on shuffled images. Name: fruit Type: num Related: fruit2 Description: A system of three linear equations has to be solved and the solution has to be entered into a fourth equation. However, the ... [Read more...]

fruit2: Image-Based Systems of Linear Equations (Single-Choice)

May 14, 2018 | R/exams

Exercise template for solving a system of three linear equations (single-choice) with a problem description based on shuffled images. Name: fruit2 Type: schoice Related: fruit Description: A system of three linear equations has to be solved and the solution has to be entered into a fourth equation. However, the system ... [Read more...]
1 7 8 9 10 11 16

Never miss an update!
Subscribe to R-bloggers to receive
e-mails with the latest R posts.
(You will not see this message again.)

Click here to close (This popup will not appear again)