
Latest USS proposal: Who would lose most?
Want to share your content on R-bloggers? click here if you have a blog, or here if you don't.
Yesterday the UUK/UCU negotiations at ACAS concluded with an agreement document.
In this post I’ll look at the numbers in those proposed interim changes to the Universities Superannuation Scheme, to work out how much money would effectively be lost by USS members at each salary level.
This is inevitably a fairly rough calculation, but its results don’t really demand more precision. The picture is very clear: the cost of “saving” USS would be felt most by USS members with low or moderate incomes.
The effective marginal rates at which money is lost by members are (as calculated below):
- 4.3% on salary up to £42k
- 10.7% on salary between £42k and the current USS threshold salary of £55.55k
- 1.0% (at most) on salary over £55.55k
This translates into the following relationship between salary and the percentage of salary lost:
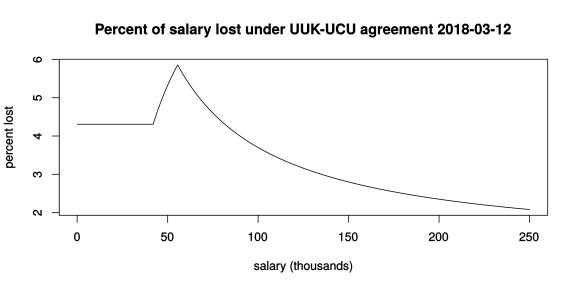
The two “kinks” in that graph reflect the discontinuities in marginal rates, at £42k and at £55.55k.
The long decay to the right continues indefinitely, ultimately approaching an asymptote at 1% lost, i.e., for those with absolutely stratospheric salaries (if such people are actually members of USS, still, that is — though I would guess that many are not).
In the rest of this post I’ll give the details of the calculation that leads to the above numbers and graph.
Just here, though, let me again comment on how unfair this “remedy” would be. The unfairness should be obvious from the above graph: those who are paid most, and would stand to benefit most from being in USS, would contribute least, in percentage terms, in this proposed move towards the future sustainability of USS. (For a more general view on this unfairness, see also my previous two posts in this “USS” category.)
The calculation
It suffices to consider salaries in three distinct bands. In each salary band, we can calculate how much is lost, per unit of salary.
The following code in R reproduces the graph drawn above. A brief explanation is then given, beneath the displayed code.
## This code runs in base R.

## Function to compute the amount that would be lost annually (£k)
## at any given salary level
sacrifice <- function(salary) { # salary in thousands
 old_threshold <- 55.55
 new_threshold <- 42
 s <- salary

## sacrifice arising from income up to the new threshold
 r1 <- min(s, new_threshold) *
         ((8.7 - 8)/100 + 23 * (1/75 - 1/85))

## sacrifice arising from income between the thresholds
 s2 <- (s > new_threshold) *
          (min(s, old_threshold) - new_threshold)
 r2 <- s2 * ((8.7 - 8)/100 + (23/75 - (12 + 8.7)/100))

## sacrifice (max) arising from income over the old threshold
 r3 <- (s > old_threshold) *
         (s - old_threshold) * (13/100 - 12/100)

return(r1 + r2 + r3)
}

## A vector of salary values up to £250k
salaries <- (1:2500) / 10

## Compute percent of salary that would be lost, at each salary level
sacrifices <- 100 * sapply(salaries, sacrifice) / salaries

## Plot the result
svg(file = "lost.svg", width = 8, height = 4)
plot(salaries, sacrifices, type = "l", xlab = "salary (thousands)", ylab = "percent lost",
 main = "Percent of salary lost under UUK-UCU agreement 2018-03-12")
dev.off()
Band 1: Salary up to £42k
All contributions from this part of salary go to the “defined benefit” part of USS.
The new proposal would see 8.7% of member’s salary up to £42k going in to this, as opposed to 8.0% at present.
The return (i.e., the value of the defined-benefit pension) can readily be calculated using the standard HMRC formula, the one that is used for Annual Allowance and Lifetime Allowance purposes.
Under current USS, the value of this part is 23 times (s/75), where s is either £42k or the member’s salary if the salary is less than £42k.
Under yesterday’s proposals, the value of this part would fall to 23 times (s/85).
The amount lost to each member, relating to salary in this first band, is then the sum of the additional contribution made and the amount of pension value lost: that is r1 in the above code.
Band 2: Salary between £42k and £55.55k
Now, for salaries greater than £42k, let s2 be the smaller of (salary minus £42k) and (£55.55k minus £42k).
Then current USS has members contributing 8% of s2 in this part, for a return of 23 times s2/75.
Yesterday’s proposal would change the contribution to 8.7% of s2, for a return of s2 times (12% + 8.7%).
Again, the amount lost to each member, relating to salary in this second band, is just the sum of the additional contribution made and the amount of pension value lost: that is r2 in the above code.
Band 3: Salary over £55.55k
The picture here is a bit more complicated, but we can at least calculate an upper bound on the amount lost at any given salary level.
The complication arises because of the optional USS “1% Match” possibility, and because losses at high salaries might need to be discounted to allow for breaching HMRC tax allowances.
But the largest possible loss in this band is incurred by someone who has taken the USS 1% Match, and has no tax-allowance issues; and that is what we calculate here.
The amount lost by such a person would be simply 1% of their salary in excess of £55.55k (since that’s the value of the lost “Match” contribution from the employer; and the employee’s own contributions still go directly to the employee’s defined-contribution pension pot). That is the quantity computed as r3 in the above code.
Conclusion
I have reproduced the full calculation here, with code, because I found the result of the calculation so shocking! If anyone reading this thinks I have made a mistake in the calculation, please do let me know.
If it is correct — and right now I have no reason to suspect otherwise — then I confess I’m alarmed that this is actually being proposed as a potential solution, even as an interim solution for the next 3 years, to the perceived problems with USS. It shakes my faith in all those who have been involved in negotiating it. With seemingly intelligent people on both sides of the table, how could they possibly come up with something as bad as this?
© David Firth, March 2018
To cite this entry:
Firth, D (2018). Latest USS proposal: Who would lose most? Weblog entry at URL https://statgeek.net/2018/03/13/latest-uss-proposal-who-would-lose-most/.
Update, 13 March pm: A tabular view of what’s in the graph
## Make a table for anyone who wants more detail than the graph
salary <- c(10:55, 55.55, 56:100, 150, 200)
percent_lost <- round(100 * sapply(salary, sacrifice) / salary, 2)
salary <- 1000 * salary
my_table <- data.frame(salary, percent_lost)
That’s the code for making a little table, showing the same numbers as those in the graph.
Here is the resulting table:
salary    %
 10000 4.31 -- I started the table at £10k for no good reason
 ...
 41000 4.31
 42000 4.31 -- the proposed new threshold
 43000 4.46
 44000 4.60
 45000 4.73
 46000 4.86
 47000 4.98
 48000 5.10
 49000 5.22
 50000 5.33
 51000 5.43
 52000 5.53
 53000 5.63
 54000 5.72
 55000 5.81
 55550 5.86 -- current USS threshold, highest % of salary lost
 56000 5.82
 57000 5.74
 58000 5.65
 59000 5.57
 60000 5.50
 61000 5.42
 62000 5.35
 63000 5.28
 64000 5.22
 65000 5.15
 66000 5.09
 67000 5.03
 68000 4.97
 69000 4.91
 70000 4.86
 71000 4.80
 72000 4.75
 73000 4.70
 74000 4.65
 75000 4.60
 76000 4.55
 77000 4.51
 78000 4.46
 79000 4.42
 80000 4.37
 81000 4.33
 82000 4.29
 83000 4.25
 84000 4.21
 85000 4.18
 86000 4.14
 87000 4.10
 88000 4.07
 89000 4.03
 90000 4.00
 91000 3.97
 92000 3.93
 93000 3.90
 94000 3.87
 95000 3.84
 96000 3.81
 97000 3.78
 98000 3.75
 99000 3.73
100000 3.70
150000 2.80
200000 2.35 -- possibly there are even some salaries this high?!
R-bloggers.com offers daily e-mail updates about R news and tutorials about learning R and many other topics. Click here if you're looking to post or find an R/data-science job.
Want to share your content on R-bloggers? click here if you have a blog, or here if you don't.