
Robust IRIS Dataset?

[This article was first published on R – TomazTsql, and kindly contributed to R-bloggers]. (You can report issue about the content on this page here)
Want to share your content on R-bloggers? click here if you have a blog, or here if you don't.
This blog post was born out of pure curiosity about the robustness of the IRIS Dataset. Biological datasets do not need to be that big in comparison to datasets of customers, consumption, stock and anything that might be volatile.
When still at the university, on one occasion I can remember, we were measuring the length of the frog legs and other frogy features. And after just a couple of measures, the further prediction was steady. Also, any kind of sampling was (RS and SRS, cluster/stratified sampling, sampling with replacements and many other creative ways of sampling) proven to be rigid, robust and would converge quickly to a good result.
Therefore, I have decided to put the IRIS dataset to the test, using a simple classification method. Calculating first the simple euclidian distance, following by finding the neighbour and based on that checking the membership of the type of flowers with the labels.
Accuracy of the prediction was tested by mapping the original species with predicted ones. And the test was, how large can a train dataset be in order to still get a good result.
After some Python and R code, the results were in.
I have tested following pairs (train:test sample size):
Want to share your content on R-bloggers? click here if you have a blog, or here if you don't.
- 80% – 20%
- 60% – 40%
- 50% – 50%
- 30% – 70%
- 10% – 90%
for x in range(3000):
    exec(open("./classification.py").read(), globals())
    x += 1
At the end I have generated the file:
 With these results, simple R code to generate the scatter plot was used:
library(ggplot2)
setwd("C:\\Predictions\\")
df_pred <- data.frame(read.table("results_split.txt", sep=";"))
p <- ggplot(df_pred, aes(df_pred$V3, df_pred$V1))
p <- p + geom_point(aes(df_pred$V3))
p <- p + labs(x="Accuracy (%) of predictions", y="Size of training subset")
p
Which resulted as:
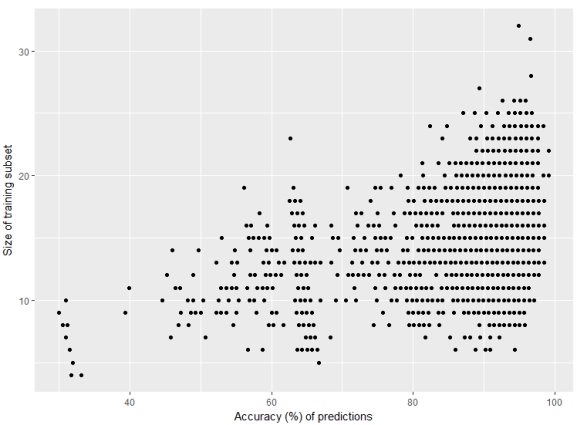 The graph clearly shows that 10% of training set (10% out of 150 observations) can generate very accurate predictions every 1,35x times.
Other pairs, when taking 30% or 50% of training set, will for sure give close to 100% accuracy almost every time.
Snippet of Python code to generate euclidean distance:
The graph clearly shows that 10% of training set (10% out of 150 observations) can generate very accurate predictions every 1,35x times.
Other pairs, when taking 30% or 50% of training set, will for sure give close to 100% accuracy almost every time.
Snippet of Python code to generate euclidean distance:
def eucl_dist(set1, set2, length):
    distance = 0
    for x in range(length):
        distance += pow(set1[x] - set2[x], 2)
    return math.sqrt(distance)
and neighbours:
def find_neighbors(train, test, nof_class):
    distances = []
    length_dist = len(test) - 1
    for x in range(len(train)):
        dist = eucl_dist(test, train[x], length_dist)
        distances.append((train[x],dist))
    distances.sort(key=operator.itemgetter(1))
    neighbour = []
    for x in range(nof_class):
        neighbour.append(distances[x][0])
    return neighbour
Conclusion, IRIS dataset is – due to the nature of the measurments and observations – robust and rigid; one can get very good accuracy results on a small training set. Everything beyond 30% for training the model, is for this particular case, just additional overload.
Happy R & Python coding! 

To leave a comment for the author, please follow the link and comment on their blog: R – TomazTsql.
R-bloggers.com offers daily e-mail updates about R news and tutorials about learning R and many other topics. Click here if you're looking to post or find an R/data-science job.
Want to share your content on R-bloggers? click here if you have a blog, or here if you don't.