June 2017

Top MBA Programs by US News

June 30, 2017 | Posts on Anything Data

Somebody once asked me for reccomendations on MBA programs based on rank and tuition. I didn’t have any information on hand, but knew how toget it. Webscraping. Webscraping is an immensly useful tool for gathering data from webpages, when it isn’t hosted on an API or stored in ... [Read more...]

Stan Weekly Roundup, 30 June 2017

June 30, 2017 | Bob Carpenter

Here’s some things that have been going on with Stan since the last week’s roundup Stan® and the logo were granted a U.S. Trademark Registration No. 5,222,891 and a U.S. Serial Number: 87,237,369, respectively. Hard to feel special when there were millions of products ahead of you. Trademarked ...
[Read more...]

Stan Weekly Roundup, 30 June 2017

June 30, 2017 | Bob Carpenter

Here’s some things that have been going on with Stan since the last week’s roundup Stan® and the logo and were was granted U.S. Trademark Registrations No. 5,222,891 and U.S. Serial Number: 87,237,369. Hard to feel special when there were millions of products ahead of you. Trademarked names ... [Read more...]

Data Visualization with googleVis exercises part 5

June 30, 2017 | Euthymios Kasvikis

Candlestick, Pie, Gauge, Intensity Charts In the fifth part of our journey we will meet some special but more and more usable types of charts that googleVis provides. More specifically you will learn about the features of Candlestick, Pie, Gauge and Intensity Charts. Read the examples below to understand the ... [Read more...]

HexJSON HTMLWidget for R, Part 3

June 30, 2017 | Tony Hirst

In HexJSON HTMLWidget for R, Part 1 I described a basic HTMLwidget for rendering hexJSON maps using d3-hexJSON, and HexJSON HTMLWidget for R, Part 2 described updates for supporting colour. Having booked off today for emergency family cover that turned out not to be required, I had another stab at the ...
[Read more...]

Cubic and Smoothing Splines in R

June 30, 2017 | Anish Singh Walia

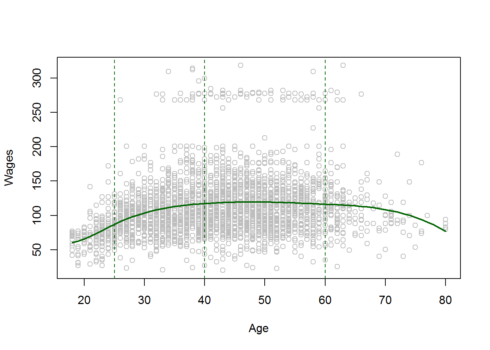
Splines are a smooth and flexible way of fitting Non linear Models and learning the Non linear interactions from the data.In most of the methods in which we fit Non linear Models to data and learn Non linearities is by transforming the data or the variables by applying a ...
[Read more...]

Model Operational Loss Directly with Tweedie GLM

June 29, 2017 | statcompute

In the development of operational loss forecasting models, the Frequency-Severity modeling approach, which the frequency and the severity of a Unit of Measure (UoM) are modeled separately, has been widely employed in the banking industry. However, sometimes it also makes sense to model the operational loss directly, especially for UoMs ... [Read more...]

HexJSON HTMLWidget for R, Part 2

June 29, 2017 | Tony Hirst

In my previous post – HexJSON HTMLWidget for R, Part 1 – I described a first attempt at an HTMLwidget for displaying hexJSON maps using d3-hexJSON. I had another play today and added a few extra features, including the ability to: add a grid (as demonstrated in the original d3-hexJSON examples), ...
[Read more...]

Algebra of Sets in R

June 29, 2017 | Aaron Schlegel

Part 4 of 4 in the series Set TheoryThe set operations, union and intersection, the relative complement and the inclusion relation (subsets) are known as the algebra of sets. The algebra of sets can be used to find many identities related to set relations that will be discussed later. We... The post ...
[Read more...]

How R is used by the FDA for regulatory compliance

June 29, 2017 | David Smith

I was recently alerted (thanks Maëlle and Mikhail!) to an enlightening presentation from last years' useR! conference. (This year's useR! conference takes place next week in Belgium.) Paul H Schuette, Scientific Computing Coordinator at the FDA Center for Drug Evaluation and Research (CDER), talked about how R is used ... [Read more...]

useR! poster: ranking influential communities

June 29, 2017 | David Selby

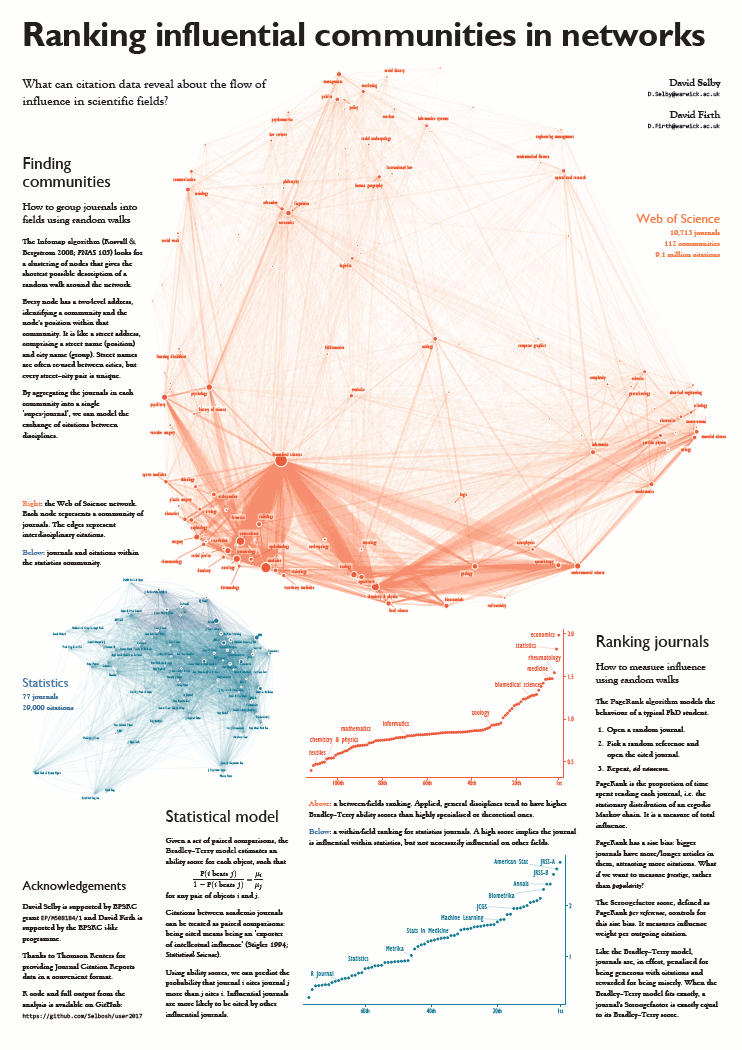
Next week I will be presenting a poster at the useR!2017 conference in Brussels. My topic is Ranking influential communities in networks. Using a large dataset of citations from the Web of Science, we grouped academic journals into communities based on their citation behaviour. These communities closely correspond to recognisable ...
[Read more...]

StatPREP Workshops

June 29, 2017 | Andy

This last weekend I helped Danny Kaplan and Kathryn Kozak (Coconino Community College) put on a StatPREP workshop. We were also joined by Amelia McNamara (Smith College) and Joe Roith (St. Catherine’s University). The idea behind StatPREP is to work directly … Continue reading →
[Read more...]

Data Manipulation with data.table (part -2)

June 29, 2017 | Biswarup Ghosh

In the last set of exercise of data.table ,we saw some interesting features of data.table .In this set we will cover some of the advanced features like set operation ,join in data.table.You should ideally complete the first part before attempting this one . Answers to the exercises ... [Read more...]

Machine Learning Explained: Overfitting

June 29, 2017 | EnhanceDataScience

Welcome to this new post of Machine Learning Explained.After dealing with bagging, today, we will deal with overfitting. Overfitting is the devil of Machine Learning and Data Science and has to be avoided in all of your models. What is overfitting? A good model is able to learn the ...
[Read more...]
1 2 3 16

Never miss an update!
Subscribe to R-bloggers to receive
e-mails with the latest R posts.
(You will not see this message again.)

Click here to close (This popup will not appear again)