October 2016

Shiny happy people in the land of the Czar

October 6, 2016 | R on Gianluca Baio

During the summer, we’ve worked silently but relentlessly to set up a departmental server that could run R-Shiny applications. There’s a bunch of us in the department doing work on R and producing packages and so we thought it’d be a good idea to disseminate our research. ...
[Read more...]

text2vec 0.4

October 6, 2016 | Data Science notes

Introducing text2vec 0.4 Today I’m pleased to announce new major release of text2vec - text2vec 0.4 which is already on CRAN. For those readers who is not familiar with text2vec - it is an R package which provides an efficient framework with a concise API for text ... [Read more...]

Import data to R from SAS, SPSS and Stata with Haven

October 6, 2016 | David Smith

Regardless of the tool you use to analyse data, you'll often have to access data living in file formats generated by other tools. The "haven" package from RStudio allows you to import and export data in SAS, SPSS and Stata formats. Version 1.0 was released on October 4, and is now available ... [Read more...]

ourworldindata: an R data package

October 6, 2016 | Simon Jackson

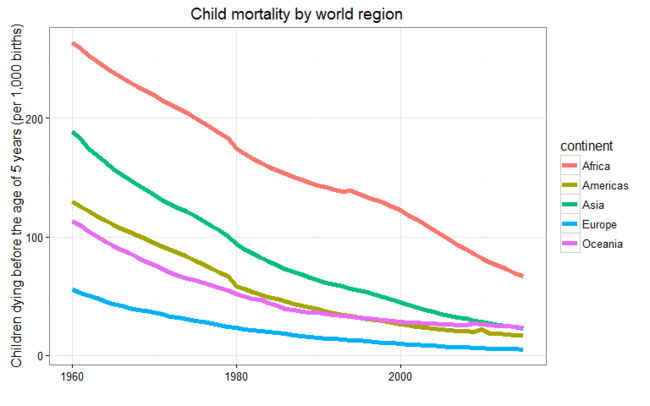
@drsimonj here to introduce ourworldindata: a new data package for R. The ourworldindata package contains data frames that are generated by combining datasets from OurWorldInData.org: “an online publication that shows how living conditions around the world are changing”. The data frames in this package have undergone tidying so that ...
[Read more...]

Raccoon: Statistical Models with R free web-book

October 6, 2016 | Quantide srl

Raccoon is a free web-book about Statistical Models with R. Raccoon is the collection of twenty years of notes, exercises and concepts working with statistics and R, and it is part of our web-book project, together with Rabbit: Introduction to R and Ramarro: R for Developers. The post Raccoon: Statistical ... [Read more...]

Creating an image of a matrix in R using image()

October 6, 2016 | biomickwatson

You have a matrix in R, and you want to visualise it – say, for example, with each cell coloured according to the value in the cell.  Not a heatmap, per se, as that requires clustering; just a simple, visual image. Well, the answer is image() – however, there is the slightly ... [Read more...]

The End of the Line

October 5, 2016 | R-SquareD

Adding labels to the end of lines indicating the last value - Often, the value of the last data point in price series data is important to the viewer. Adding these yourself is always clumsy. I considered creating my own geom to...
[Read more...]

The case for reproducibility

October 5, 2016 | The USGS OWI blog

Science is hard. Why make it harder? Scientists and researchers spend a lot of time on data preparation and analysis, and some of these analyses are quite computationally intensive. The amount of time required to conduct an analysis grows for the increased complexity of calculations, amount of data, and number ... [Read more...]

R Puzzle No. 2 – Where’s the zebra?

October 5, 2016 | José Romero

For the second R puzzle, we will tackle the famous Zebra Puzzle, sometimes known as Einstein's Puzzle or Einstein's Riddle. There are various implementations of solutions to the puzzle in different programming languages1, but here we will be using R and an R package called lpSolve, which is intended to ...
[Read more...]
1 11 12 13 14 15

Never miss an update!
Subscribe to R-bloggers to receive
e-mails with the latest R posts.
(You will not see this message again.)

Click here to close (This popup will not appear again)