August 2016

Higher Order Functions Exercises

August 5, 2016 | r-exercises

Higher order functions are functions that take other functions as arguments or return functions as their result. In this set of exercises we will focus on the former. R has a set of built-in higher order functions: Map, Reduce, Filter, Find, Position, Negate. They enable us to complete complex operations ... [Read more...]

Interactive, Illustrator-quality graphics with R

August 5, 2016 | David Smith

While many media properties including the New York Times, FiveThirtyEight and FlowingData use the R language to prepare graphics for publication, they often use Adobe Illustrator or similar graphics tools to touch up the last 5% or so of the graphics. Not so for Switzerland's news site swissinfo.ch, whose data ... [Read more...]

RcppStreams 0.1.1

August 5, 2016 | Thinking inside the box

A maintenance release of RcppStreams is now on CRAN. RcppStreams brings the excellent Streamulus C++ template library for event stream processing to R. Streamulus, written by Irit Katriel, uses very clever template meta-programming (via Boost Fusion... [Read more...]

Plotting GPX tracks with Shiny and Leaflet

August 5, 2016 | Sascha W.

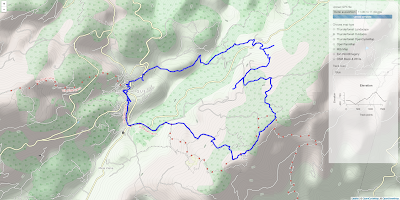
Lately, I got the chance to play around with Shiny and Leaflet a lot - and it is really fun! So I decided to catch up on an old post of mine and build a Shiny application where you can upload your own GPX files and plot them directly in ...
[Read more...]

NZ Real GDP htmlwidget

August 5, 2016 | Andrew Worsley

Thought I would try my hand at generating an interactive JavaScript line graph using R. Thankfully the dygraphs package makes this very easy! The code below generates an interactive plot of New Zealand’s real GDP through time. I have added some annotations displaying some of the major financial crises. ...
[Read more...]

Something Strange in the Neighborhood

August 4, 2016 | Julia Silge

Today I was so pleased to see a new data package hit CRAN, and how wonderful to see such accomplished women writing R packages. What a great new data package on CRAN! And always great to see more women authors in #rstats https://t.co/nROMibqPxX pic.twitter.com/UEayWgx9... [Read more...]

Getting Your Colleagues Hooked on R

August 4, 2016 | DataCamp Blog

You love R and you want your colleagues to love R too. In our latest post we will walk you through seven tips and tricks for hosting a successful R demo at your company that will really impress your colleagues. You can read the full post at 7 Tips F... [Read more...]

A “NetCDF 4 in R” cheatsheet

August 4, 2016 | philmassie

I recently promised a "NetCDF in R" cheat sheet to a friend, and I thought it might make a useful tutorial. NetCDF files are often used to distribute gridded, multidimensional spatial data such as sea surface temperature, chlorophyll-a levels and so on. NetCDF is more than just a file format, ... [Read more...]

No Sleep During the Reproducibility Session

August 3, 2016 | Theory meets practice...

This work is licensed under a Creative Commons Attribution-ShareAlike 4.0 International License. The markdown+Rknitr source code of this blog is available under a GNU General Public License (GPL v3) license from . Abstract R code is provided for implementing a statistical method by Nishiura, Miyamatsu, and Mizumoto (2016) to assess when to ...
[Read more...]

fashion() output with corrr

August 3, 2016 | Simon Jackson

Tired of trying to get your data to print right or formatting it in a program like excel? Try out fashion() from the corrr package: d gender age height fte #__ 1 Male NA 188.0000 NA #__ 2 Female 28.11111 NA 0.78273 #__ 3 74.30000 168.7891 0.90000 library(corrr) fashion(d) #__ gender age height fte #__ 1 Male 188.00 #__ 2 Female 28.11 .78 #__ 3 74.30 168.79 .90 But how does it work ... [Read more...]
1 10 11 12 13 14

Never miss an update!
Subscribe to R-bloggers to receive
e-mails with the latest R posts.
(You will not see this message again.)

Click here to close (This popup will not appear again)